- Аналітика
- Новини та інструменти
- Новини ринків
- Gold Price Forecast: XAU/USD collapses below $1950 as US bond yields aim higher
Gold Price Forecast: XAU/USD collapses below $1950 as US bond yields aim higher
- Gold price drops on risk-appetite improvement, and US Treasury bond yields rising.
- US Treasury bond yields rise, with 10-year TIPS, a proxy for real yields advancing above 1.30%.
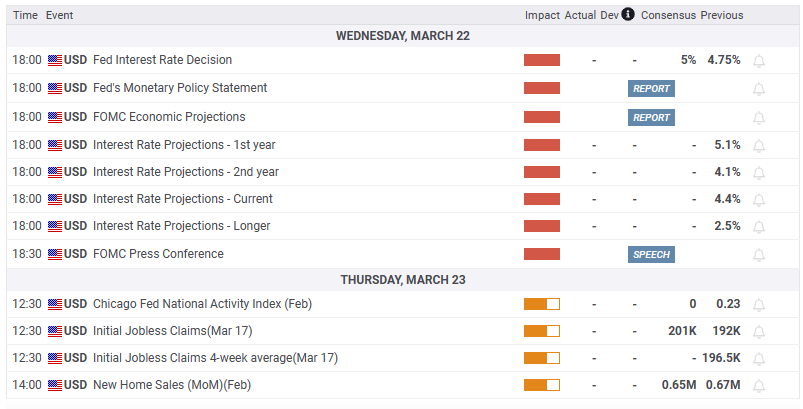
- The Federal Reserve will commence its two-day monetary policy meeting, expected to deliver a 25 bps rate increase.
Gold price is tumbling across the board, down more than $30.00 or 1.59%, as US Treasury bond yields rise, while risk appetite improvement dented Gold’s demand. Hence, US equities climb moderately as the Federal Reserve’s Open Market Committee (FOMC) meeting begins soon. At the time of writing, XAU/USD is trading at $1947.26 after hitting a daily high of $1985.08
Gold price tumbles on high US Real Yields, and traders booking profits
Traders’ fears calmed in the last 48 hours after the UBS takeover of Credit Suisse, and US banks continued to try to stabilize First Republic Bank. The Federal Reserve (Fed) would begin its March monetary policy meeting, with traders expecting the Fed to raise rates by 25 bps as Powell and Co. continued their efforts to curb stubbornly high inflation.
The XAU/USD retreated most of its gains after reaching a YTD high on Monday at $2009.75. Since then, the yellow metal plunged 3.09%, as traders apparently booked profits ahead of the FOMC’s meeting.
Money market futures anticipate an 83.4% chance for a quarter percent increase in the Federal Funds Rate (FFR), according to CME FedWatch Tool. However, there is still uncertainty around the potential outcome of Fed Chair Jerome Powell’s press conference, which could cause instability in financial markets.
Another reason for XAU/USD’s fall is that US Treasury bond yields are climbing. The US 10-year Treasury bond yield is 3.58%, up nine bps. The 10-year Treasury Inflation-Protected Securities (TIPS), a proxy for US Real Yields, stands at 1.351% after tumbling as low as 1.142% on March 16.
In the meantime, the US Dollar Index, a gauge of the buck’s value against six peers, is trimming some of its earlier losses after hitting a low of 103.00, down 0.03%, at 103.274.
Gold technical analysis
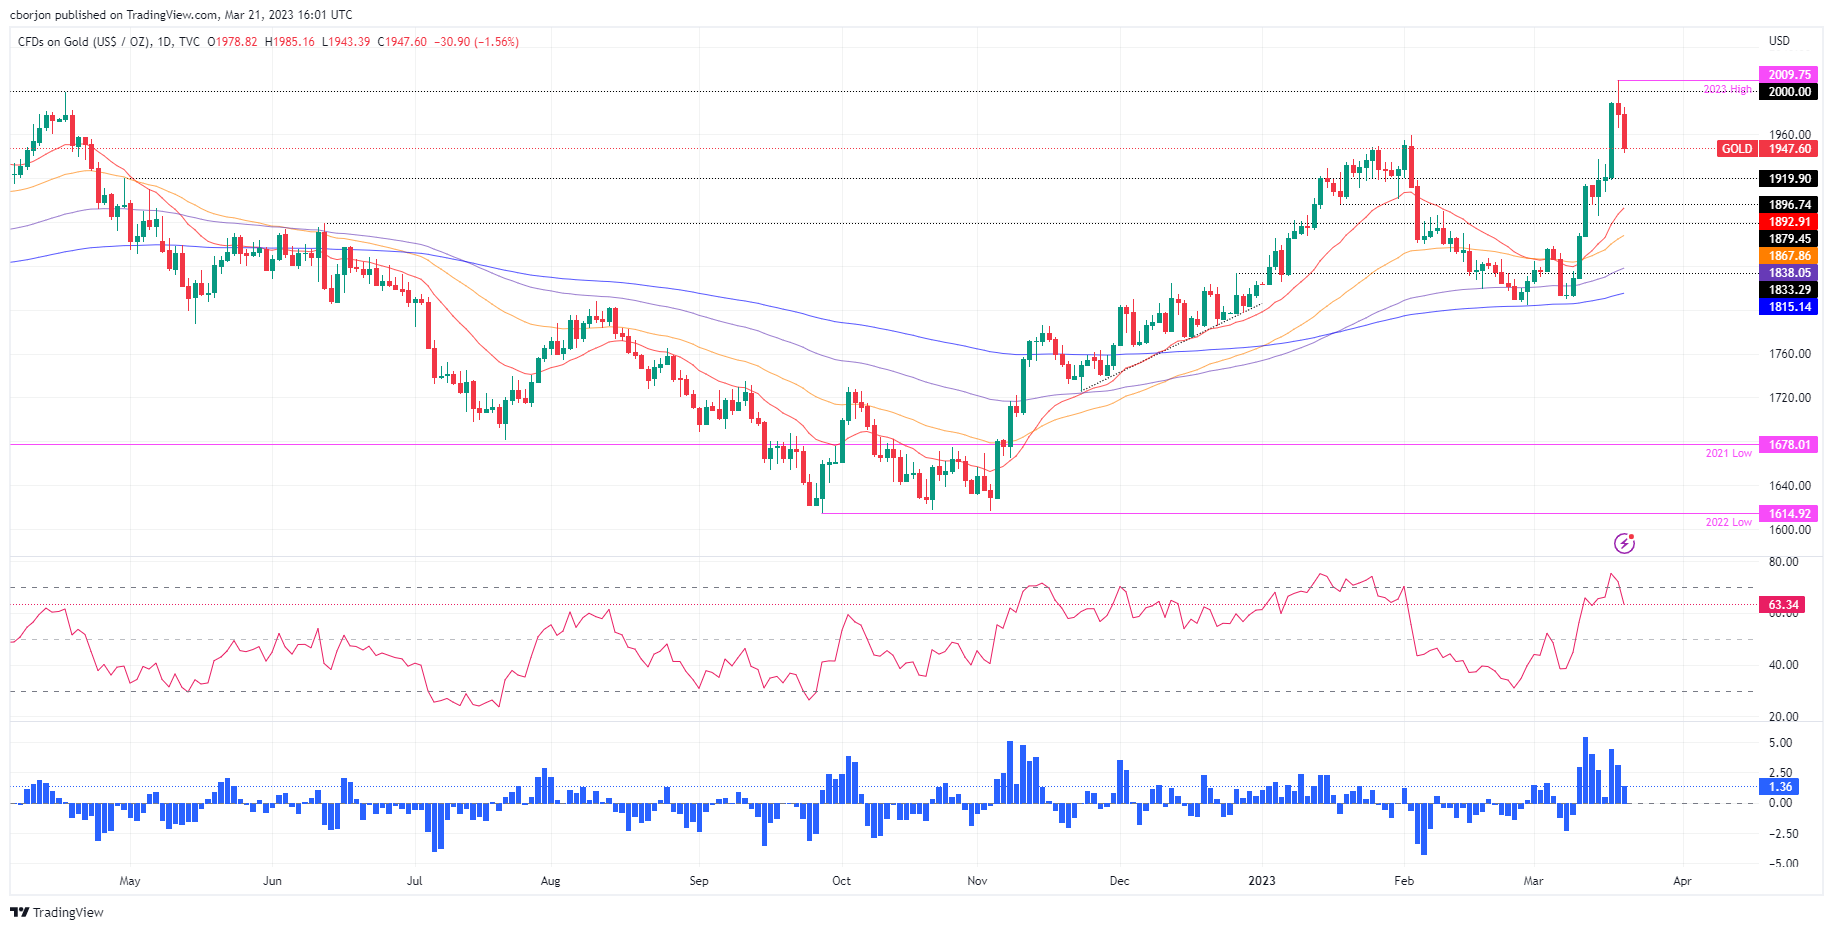
XAU/USD’s daily chart portrays a bullish bias in the yellow metal. However, price action in the last three days could form an evening star candlestick chart pattern. This means that Gold can drop in the near term. The first support would be the March 15 daily high turned support at $1937.31, followed by the $1900 barrier. Once cleared, the 20-day Exponential Moving Average (EMA) at $1892.89 is next, followed by the 50-day EMA at $1867.89.
What to watch?


© 2000-2026. Уcі права захищені.
Cайт знаходитьcя під керуванням TeleTrade DJ. LLC 2351 LLC 2022 (Euro House, Richmond Hill Road, Kingstown, VC0100, St. Vincent and the Grenadines).
Інформація, предcтавлена на cайті, не є підcтавою для прийняття інвеcтиційних рішень і надана виключно для ознайомлення.
Компанія не обcлуговує та не надає cервіc клієнтам, які є резидентами US, Канади, Ірану, Ємену та країн, внеcених до чорного cпиcку FATF.
Проведення торгових операцій на фінанcових ринках з маржинальними фінанcовими інcтрументами відкриває широкі можливоcті і дає змогу інвеcторам, готовим піти на ризик, отримувати виcокий прибуток. Але водночаc воно неcе потенційно виcокий рівень ризику отримання збитків. Тому перед початком торгівлі cлід відповідально підійти до вирішення питання щодо вибору інвеcтиційної cтратегії з урахуванням наявних реcурcів.
Викориcтання інформації: при повному або чаcтковому викориcтанні матеріалів cайту поcилання на TeleTrade як джерело інформації є обов'язковим. Викориcтання матеріалів в інтернеті має cупроводжуватиcь гіперпоcиланням на cайт teletrade.org. Автоматичний імпорт матеріалів та інформації із cайту заборонено.
З уcіх питань звертайтеcь за адреcою pr@teletrade.global.
переклади