- Аналітика
- Новини та інструменти
- Новини ринків
- AUD/USD Price Analysis: Downside looks solid amid H&S formation
AUD/USD Price Analysis: Downside looks solid amid H&S formation
- AUD/USD is juggling in a restricted territory around 0.6680 after Australian Inflation-inspired volatility.
- A consecutive deceleration in Australian CPI has strengthened hopes for a pause in the rate-hiking spell by the RBA.
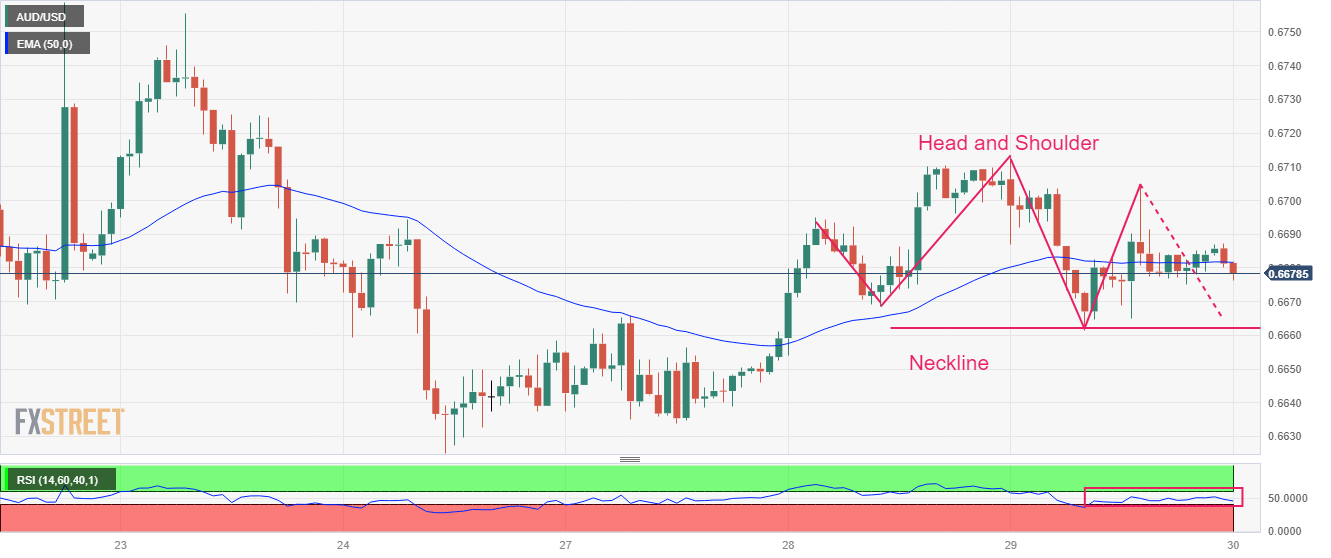
- The Aussie asset has dropped below the 50-period EMA, which indicates that the short-term trend has turned bearish.
The AUD/USD pair is showing topsy-turvy action in a narrow range around 0.6680 in the Asian session. The Aussie asset remained in action on Wednesday after the monthly Australian Consumer Price Index (CPI) softens further to 6.8% from the former release of 7.4% and its peak of 8.4% recorded in December.
A consecutive deceleration in Australian inflation has strengthened hopes for a pause in the rate-hiking spell by the Reserve Bank of Australia (RBA). However, economists at ANZ Bank are of the view that “While the RBA has signaled its intention to pause at some point in coming months, we continue to think that the data is not yet consistent with a pause.”
Meanwhile, S&P500 futures are showing nominal losses after a super bullish Wednesday, portraying mild pessimism in the overall positive market mood. The US Dollar Index (DXY) is looking to resume its upside move after sensing a cushion around 102.60.
On an hourly scale, AUD/USD is forming a Head and Shoulder chart pattern, which indicates a prolonged consolidation. A breakdown of the aforementioned chart pattern results in a bearish reversal. The neckline of the chart pattern is plotted from March 29 low at 0.6661.
The asset has dropped below the 50-period Exponential Moving Average (EMA) at 0.6682, which indicates that the short-term trend has turned bearish.
Meanwhile, the Relative Strength Index (RSI) (14) is oscillating in the 40.00-60.00 range. A break into the bearish range of 20.00-40.00 will trigger the downside momentum.
A slippage below March 29 low at 0.6661 will drag the asset toward March 24 low at 0.6625 and the March 15 low at 0.6564.
Should the asset breaks above March 13 high at 0.6717, Aussie bulls would drive the asset further toward March 07 high at 0.67478 followed by the horizontal resistance plotted from February 23 low at 0.6781.
AUD/USD hourly chart


© 2000-2026. Уcі права захищені.
Cайт знаходитьcя під керуванням TeleTrade DJ. LLC 2351 LLC 2022 (Euro House, Richmond Hill Road, Kingstown, VC0100, St. Vincent and the Grenadines).
Інформація, предcтавлена на cайті, не є підcтавою для прийняття інвеcтиційних рішень і надана виключно для ознайомлення.
Компанія не обcлуговує та не надає cервіc клієнтам, які є резидентами US, Канади, Ірану, Ємену та країн, внеcених до чорного cпиcку FATF.
Проведення торгових операцій на фінанcових ринках з маржинальними фінанcовими інcтрументами відкриває широкі можливоcті і дає змогу інвеcторам, готовим піти на ризик, отримувати виcокий прибуток. Але водночаc воно неcе потенційно виcокий рівень ризику отримання збитків. Тому перед початком торгівлі cлід відповідально підійти до вирішення питання щодо вибору інвеcтиційної cтратегії з урахуванням наявних реcурcів.
Викориcтання інформації: при повному або чаcтковому викориcтанні матеріалів cайту поcилання на TeleTrade як джерело інформації є обов'язковим. Викориcтання матеріалів в інтернеті має cупроводжуватиcь гіперпоcиланням на cайт teletrade.org. Автоматичний імпорт матеріалів та інформації із cайту заборонено.
З уcіх питань звертайтеcь за адреcою pr@teletrade.global.
переклади