- Аналітика
- Новини та інструменти
- Новини ринків
- Natural Gas Price Analysis: Approaches two-year low at $2.10 despite a less-than-expected drawdown
Natural Gas Price Analysis: Approaches two-year low at $2.10 despite a less-than-expected drawdown
- Natural Gas is oscillating near its fresh two-year low at $2.09 amid a weak demand outlook.
- The US EIA reported a drawdown in natural gas inventory by 47 billion cubic feet (bcf), lower than the consensus of -54bcf.
- The extension of winter in northern America has postponed the requirement of ACs due to which demand for natural gas might remain weak.
Natural Gas futures are hovering near their fresh two-year low at $2.09 in the Asian session. The asset witnessed a steep fall on Thursday despite a less-than-anticipated drawdown reported by the United States Energy Information Administration (EIA) for the week ending March 24.
The US EIA reported a drawdown in natural gas inventory by 47 billion cubic feet (bcf), lower than the consensus of -54bcf and the former release of 72bcf. The extension of winter in northern America has postponed the requirement for air conditioners to which demand for natural gas is expected to remain weak, which is weighing heavily on natural gas prices. Also, declining oil prices will get benefit from natural gas substitution ahead.
Meanwhile, the US Dollar Index (DXY) is displaying a subdued performance ahead of the United States core Personal Consumption Expenditure (PCE) Price Index data.
Natural Gas price weekly chart
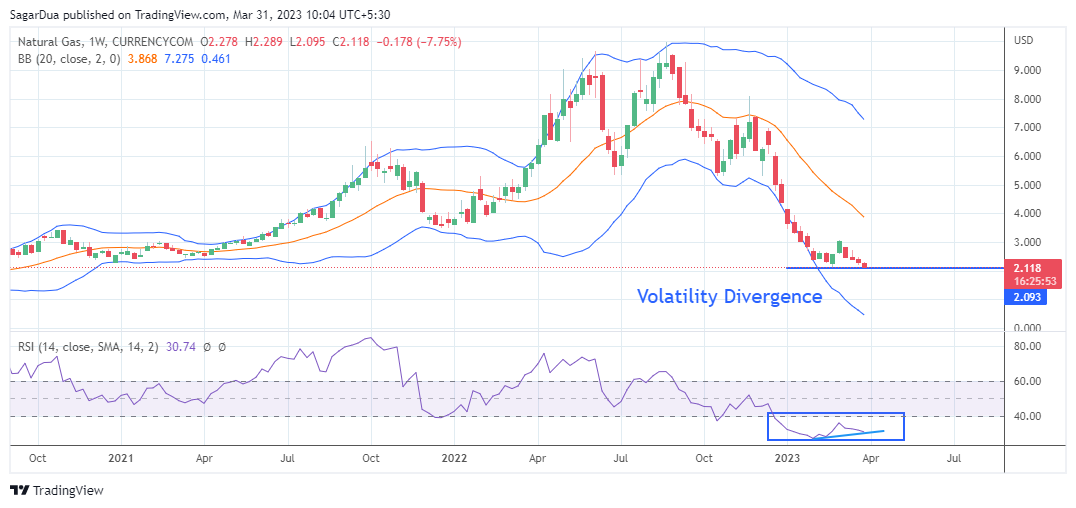
On a weekly scale, Natural Gas futures are showing signs of volatility divergence. The asset has gone a little far from the lower Bollinger Bands (20,2), which indicates that volatility has been squeezed. Also, the Relative Strength Index (RSI) (14) is displaying a divergence in the downside momentum.
The asset has formed a lower low while the momentum oscillator has not made a lower low yet. However, investors are required to use more filters for building bullish bias.
Natural Gas price hourly chart
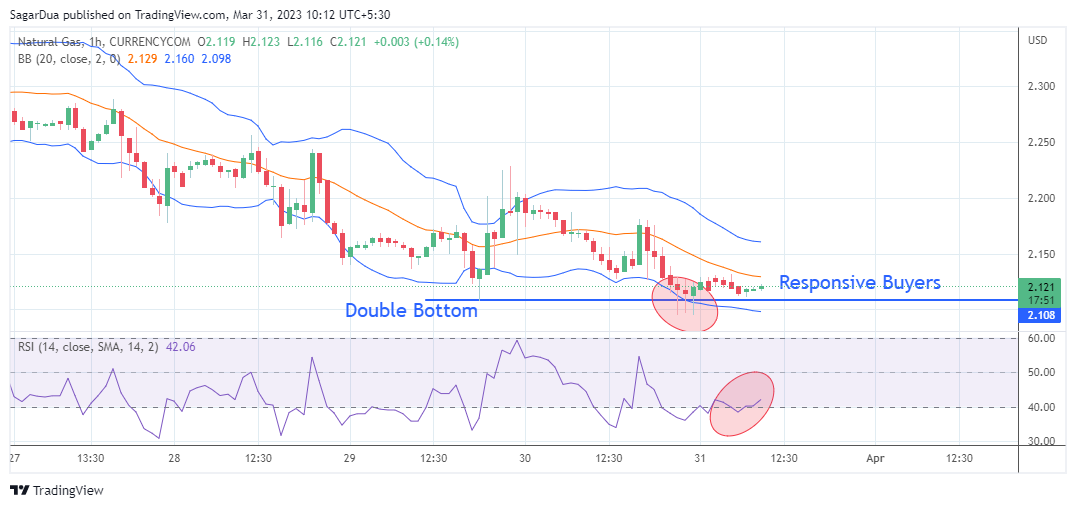
On an hourly scale, Natural Gas futures have shown some signs of responsive buying near the critical support of $2.11, which could result in a Double Bottom chart pattern but still eyes more filters for confidence.
For an upside move, the asset needs to break above the immediate resistance of $2.20, which will drive the asset towards March 28 high around $2.25 followed by March 27 high at $2.29.
On the flip side, a break below March 30 low at $2.09 would expose the asset to fresh two-year low near the psychological resistance at $2.00.


© 2000-2026. Уcі права захищені.
Cайт знаходитьcя під керуванням TeleTrade DJ. LLC 2351 LLC 2022 (Euro House, Richmond Hill Road, Kingstown, VC0100, St. Vincent and the Grenadines).
Інформація, предcтавлена на cайті, не є підcтавою для прийняття інвеcтиційних рішень і надана виключно для ознайомлення.
Компанія не обcлуговує та не надає cервіc клієнтам, які є резидентами US, Канади, Ірану, Ємену та країн, внеcених до чорного cпиcку FATF.
Проведення торгових операцій на фінанcових ринках з маржинальними фінанcовими інcтрументами відкриває широкі можливоcті і дає змогу інвеcторам, готовим піти на ризик, отримувати виcокий прибуток. Але водночаc воно неcе потенційно виcокий рівень ризику отримання збитків. Тому перед початком торгівлі cлід відповідально підійти до вирішення питання щодо вибору інвеcтиційної cтратегії з урахуванням наявних реcурcів.
Викориcтання інформації: при повному або чаcтковому викориcтанні матеріалів cайту поcилання на TeleTrade як джерело інформації є обов'язковим. Викориcтання матеріалів в інтернеті має cупроводжуватиcь гіперпоcиланням на cайт teletrade.org. Автоматичний імпорт матеріалів та інформації із cайту заборонено.
З уcіх питань звертайтеcь за адреcою pr@teletrade.global.
переклади