- Аналітика
- Новини та інструменти
- Новини ринків
- Gold Price Forecast: XAU/USD stays bullish beyond $1,990 – Confluence Detector
Gold Price Forecast: XAU/USD stays bullish beyond $1,990 – Confluence Detector
- Gold price edges lower in its battle with the wall of resistance around $2,010.
- Recession woes, geopolitical concerns challenge XAU/USD bulls near multi-month high.
- US NFP needs to part ways from downbeat US data to renew hawkish Fed bias.
- US inflation, FOMC Minutes also eyed to better predict May’s Fed rate hike.
Gold price (XAU/USD) slips off bull’s radar for a while as markets consolidate amid the Good Friday holiday, despite being set for the weekly gain to around $2,007. Adding filters to the XAU/USD trading is the cautious mood ahead of the US employment data for March, as well as the looming recession woes. It should be noted, however, that the recently downbeat US employment clues and easing hawkish concerns about the Fed’s next move keep the Gold price firmer, backed by a weaker US Dollar.
Moving on, Nonfarm Payrolls (NFP) need to match the downbeat expectations from the jobs report to keep Gold buyers in the driver’s seat. In absence of this, the Gold price may extend the latest pullback towards the $1,990 support confluence with eyes on the key US inflation and Fed Minutes.
Also read: Gold Price Forecast: XAU/USD could aim for $2,043 on weak US Nonfarm Payrolls report
Gold Price: Key levels to watch
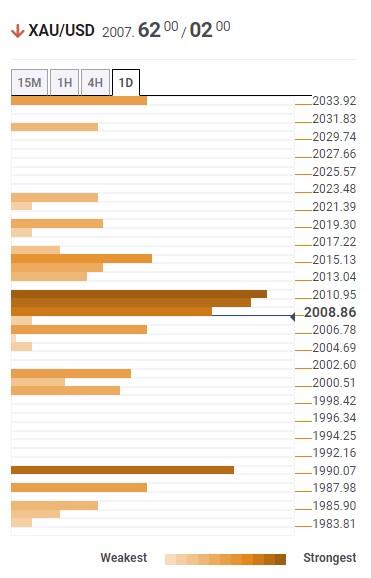
Our Technical Confluence Indicator shows that the Gold price recently slipped beneath the $2,010 key support confluence while pausing the run-up to poke the previous yearly high marked in March 2022.
The stated support confluence, now resistance, includes Fibonacci 38.2% on one-day, previous monthly high and Pivot Point one-week R2.
In a case where the Gold price jumps back beyond the $2,010 level, the Fibonacci 161.8% on one-week and SMA10 on 4H can check the XAU/USD bulls around $2,015 before restoring the previous upside bias.
Following that, a run-up towards the Pivot Point one-week R3, around $2,035 becomes swift.
On the contrary, the metal’s sustained trading below $2,010 can drag it to another key support for the Gold price, surrounding $1,990, which encompasses Pivot Point one-day S2 and Pivot Point one-week R1.
Should the XAU/USD bears keep the reins past $1,990, the odds of witnessing a slump toward the February 2022 peak of around $1,960 and multiple lows close to $1,950 can’t be ruled out.
Here is how it looks on the tool
About Technical Confluences Detector
The TCD (Technical Confluences Detector) is a tool to locate and point out those price levels where there is a congestion of indicators, moving averages, Fibonacci levels, Pivot Points, etc. If you are a short-term trader, you will find entry points for counter-trend strategies and hunt a few points at a time. If you are a medium-to-long-term trader, this tool will allow you to know in advance the price levels where a medium-to-long-term trend may stop and rest, where to unwind positions, or where to increase your position size.


© 2000-2026. Уcі права захищені.
Cайт знаходитьcя під керуванням TeleTrade DJ. LLC 2351 LLC 2022 (Euro House, Richmond Hill Road, Kingstown, VC0100, St. Vincent and the Grenadines).
Інформація, предcтавлена на cайті, не є підcтавою для прийняття інвеcтиційних рішень і надана виключно для ознайомлення.
Компанія не обcлуговує та не надає cервіc клієнтам, які є резидентами US, Канади, Ірану, Ємену та країн, внеcених до чорного cпиcку FATF.
Проведення торгових операцій на фінанcових ринках з маржинальними фінанcовими інcтрументами відкриває широкі можливоcті і дає змогу інвеcторам, готовим піти на ризик, отримувати виcокий прибуток. Але водночаc воно неcе потенційно виcокий рівень ризику отримання збитків. Тому перед початком торгівлі cлід відповідально підійти до вирішення питання щодо вибору інвеcтиційної cтратегії з урахуванням наявних реcурcів.
Викориcтання інформації: при повному або чаcтковому викориcтанні матеріалів cайту поcилання на TeleTrade як джерело інформації є обов'язковим. Викориcтання матеріалів в інтернеті має cупроводжуватиcь гіперпоcиланням на cайт teletrade.org. Автоматичний імпорт матеріалів та інформації із cайту заборонено.
З уcіх питань звертайтеcь за адреcою pr@teletrade.global.
переклади