- Аналітика
- Новини та інструменти
- Новини ринків
- Gold Price Forecast: XAU/USD juggles above $2,040 ahead of US Retail Sales for further guidance
Gold Price Forecast: XAU/USD juggles above $2,040 ahead of US Retail Sales for further guidance
- Gold price is oscillating above $2,040.00 as investors await US Retail Sales.
- S&P500 settled Thursday’s session on a super-bullish note as fears of abrupt rate hikes cool down after softening of US PPI.
- The retail demand is likely to continue the pace of contraction as shown in February.
Gold price (XAU/USD) is consolidating in a narrow range above $2,040.00 in the early Asian session. The precious metal turned sideways in the New York session after printing a fresh annual high at $2,048.77 in hopes that the Federal Reserve (Fed) is required to take a pause call on the policy-tightening process as early as possible.
S&P500 settled Thursday’s session on a super-bullish note as fears of abrupt rate hikes cool down after softening of United States Producer Price Index (PPI) data, portraying a decent jump in the risk appetite of the market participants.
The US Dollar Index (DXY) refreshed its two-month low at 100.85 as the softened US Consumer Price Index (CPI) joined the heavily decelerated PPI and trimmed consumer inflation expectations dramatically. The USD Index has turned rangebound after a plunge ahead of US Retail Sales data. Contrary to that, demand for US government bonds remained weak despite easing inflation concerns. The yields offered on 10-year Treasury bonds jumped to near 3.45%.
The street is shifting its focus toward the monthly US Retail Sales (March) data. According to the consensus, the economic data will contract by 0.4%. The retail demand is likely to continue the pace of contraction as shown in February as US labor market conditions are cooling down. Also, the banking fiasco has impacted the confidence of households.
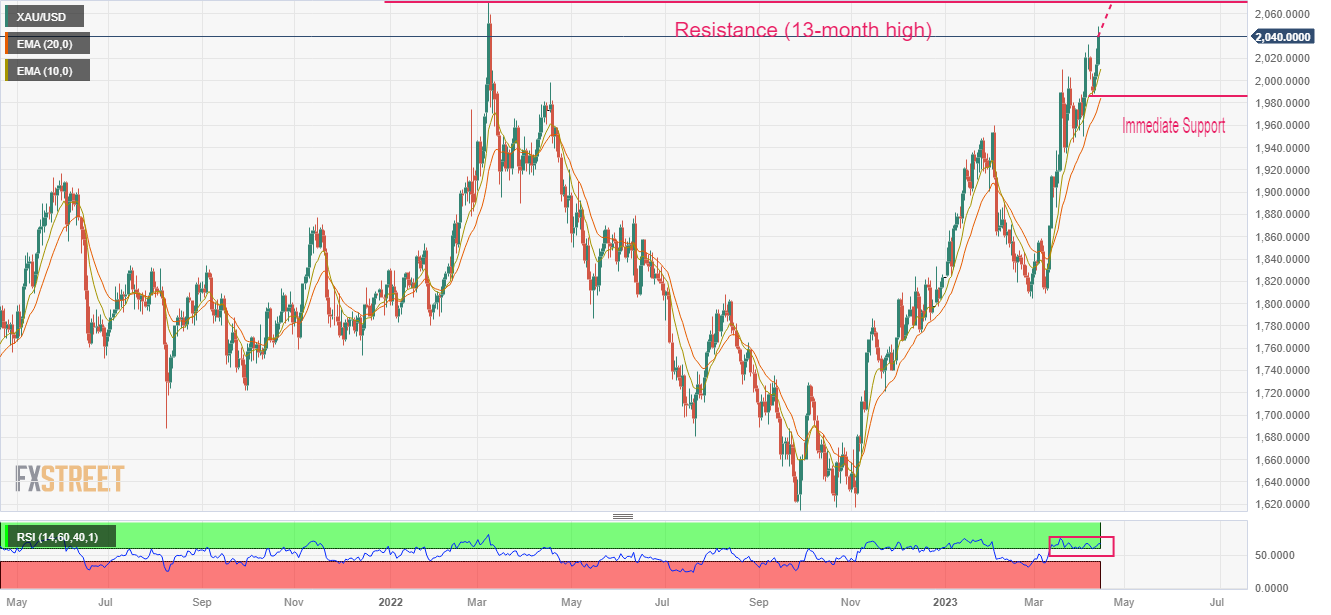
Gold technical analysis
Gold price is marching north to test a 13-month high at $2,070.54, which is 08 March 2022 high, plotted on the daily scale. Upward-sloping 10-and 20 period Exponential Moving Averages (EMAs) at $2,010.84 and $1,987.00 respectively, indicating a sheer strength in Gold bulls.
The Relative Strength Index (RSI) (14) is oscillating in the bullish range of 60.00-80.00, showing no signs of divergence and any sign of an oversold situation, cementing more upside ahead.
Gold daily chart


© 2000-2026. Уcі права захищені.
Cайт знаходитьcя під керуванням TeleTrade DJ. LLC 2351 LLC 2022 (Euro House, Richmond Hill Road, Kingstown, VC0100, St. Vincent and the Grenadines).
Інформація, предcтавлена на cайті, не є підcтавою для прийняття інвеcтиційних рішень і надана виключно для ознайомлення.
Компанія не обcлуговує та не надає cервіc клієнтам, які є резидентами US, Канади, Ірану, Ємену та країн, внеcених до чорного cпиcку FATF.
Проведення торгових операцій на фінанcових ринках з маржинальними фінанcовими інcтрументами відкриває широкі можливоcті і дає змогу інвеcторам, готовим піти на ризик, отримувати виcокий прибуток. Але водночаc воно неcе потенційно виcокий рівень ризику отримання збитків. Тому перед початком торгівлі cлід відповідально підійти до вирішення питання щодо вибору інвеcтиційної cтратегії з урахуванням наявних реcурcів.
Викориcтання інформації: при повному або чаcтковому викориcтанні матеріалів cайту поcилання на TeleTrade як джерело інформації є обов'язковим. Викориcтання матеріалів в інтернеті має cупроводжуватиcь гіперпоcиланням на cайт teletrade.org. Автоматичний імпорт матеріалів та інформації із cайту заборонено.
З уcіх питань звертайтеcь за адреcою pr@teletrade.global.
переклади