- Аналітика
- Новини та інструменти
- Новини ринків
- Gold Price Forecast: XAU/USD gathers strength to capture $2,050 as US economy eyes recession
Gold Price Forecast: XAU/USD gathers strength to capture $2,050 as US economy eyes recession
- Gold price is aiming to capture the critical resistance of $2,050.00 as USD Index is eyeing more downside.
- Reduced borrowing by US banks from the Fed is advocating further slowdown in the US economy.
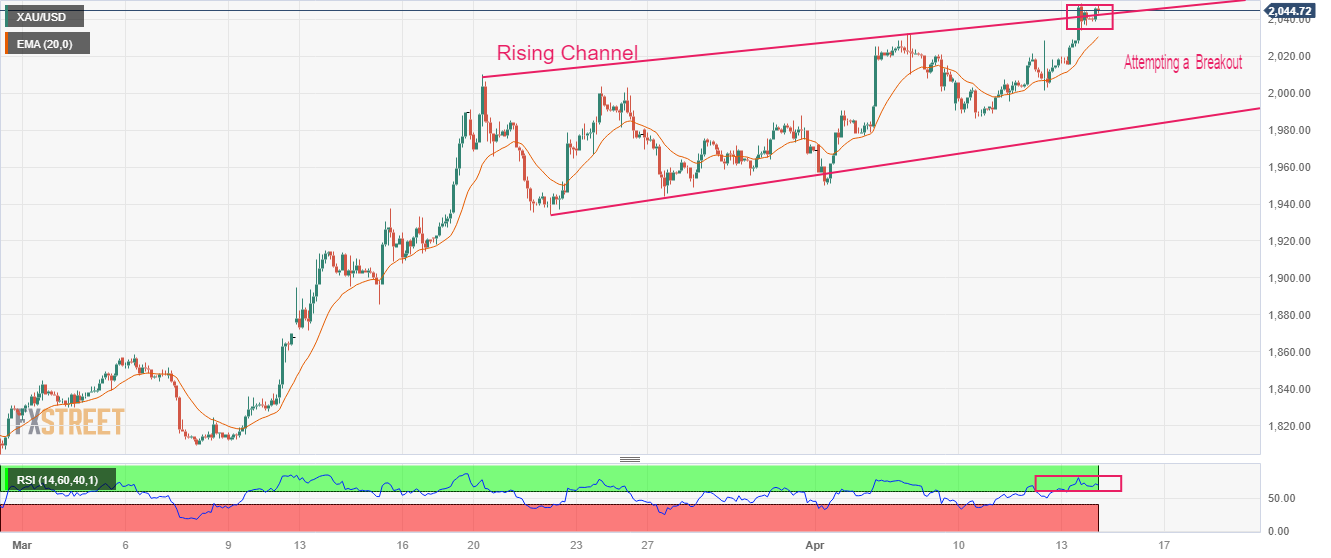
- Gold price is on the verge of delivering a breakout of the Rising Channel pattern.
Gold price (XAU/USD) is gathering strength to capture the critical resistance of $2,050.00 in the Asian session. The precious metal is looking to resume its upside journey after mild exhaustion in the upside momentum.
S&P500 futures are showing choppy moves in the Asian session after witnessing stellar buying on Thursday, portraying a risk appetite theme underpinned by the market participants. The US Dollar Index (DXY) has refreshed its 11-month low at 100.80 and is eyeing more weakness as investors are anticipating that the Federal Reserve (Fed) will look for pausing rate hikes after May monetary policy meeting.
Bloomberg reported that United States commercial banks reduced their borrowings from two Federal Reserve backstop lending facilities for a fourth straight week as liquidity constraints continue to ease following the collapse of Silicon Valley Bank last month. Lower credit disposal due to tight credit conditions could slow down the US economy, which might ease inflationary pressures sooner and force Fed chair Jerome Powell to wrap up the policy-tightening spell sooner.
On Friday, a power-pack action is expected from the USD Index amid the release of the US Retail Sales data. According to the consensus, the economic data will contract by 0.4%. The retail demand is likely to continue the pace of contraction as shown in February as US labor market conditions are cooling down.
Gold technical analysis
Gold price is auctioning in a Rising Channel chart pattern on a two-hour scale in which every pullback is capitalized for building fresh longs by the market participants. The yellow metal is consolidating near the breakout region of the aforementioned chart pattern.
Advancing 20-period Exponential Moving Average (EMA) at $2,031.00 is favoring more upside for Gold bulls.
The Relative Strength Index (RSI) (14) is oscillating in the bullish range of 60.00-80.00, indicating that the upside momentum is already active.
Gold two-hour chart


© 2000-2026. Уcі права захищені.
Cайт знаходитьcя під керуванням TeleTrade DJ. LLC 2351 LLC 2022 (Euro House, Richmond Hill Road, Kingstown, VC0100, St. Vincent and the Grenadines).
Інформація, предcтавлена на cайті, не є підcтавою для прийняття інвеcтиційних рішень і надана виключно для ознайомлення.
Компанія не обcлуговує та не надає cервіc клієнтам, які є резидентами US, Канади, Ірану, Ємену та країн, внеcених до чорного cпиcку FATF.
Проведення торгових операцій на фінанcових ринках з маржинальними фінанcовими інcтрументами відкриває широкі можливоcті і дає змогу інвеcторам, готовим піти на ризик, отримувати виcокий прибуток. Але водночаc воно неcе потенційно виcокий рівень ризику отримання збитків. Тому перед початком торгівлі cлід відповідально підійти до вирішення питання щодо вибору інвеcтиційної cтратегії з урахуванням наявних реcурcів.
Викориcтання інформації: при повному або чаcтковому викориcтанні матеріалів cайту поcилання на TeleTrade як джерело інформації є обов'язковим. Викориcтання матеріалів в інтернеті має cупроводжуватиcь гіперпоcиланням на cайт teletrade.org. Автоматичний імпорт матеріалів та інформації із cайту заборонено.
З уcіх питань звертайтеcь за адреcою pr@teletrade.global.
переклади