- Аналітика
- Новини та інструменти
- Новини ринків
- NZD/JPY Price Analysis: Bullish strength persists, additional corrective pullbacks are possible
NZD/JPY Price Analysis: Bullish strength persists, additional corrective pullbacks are possible
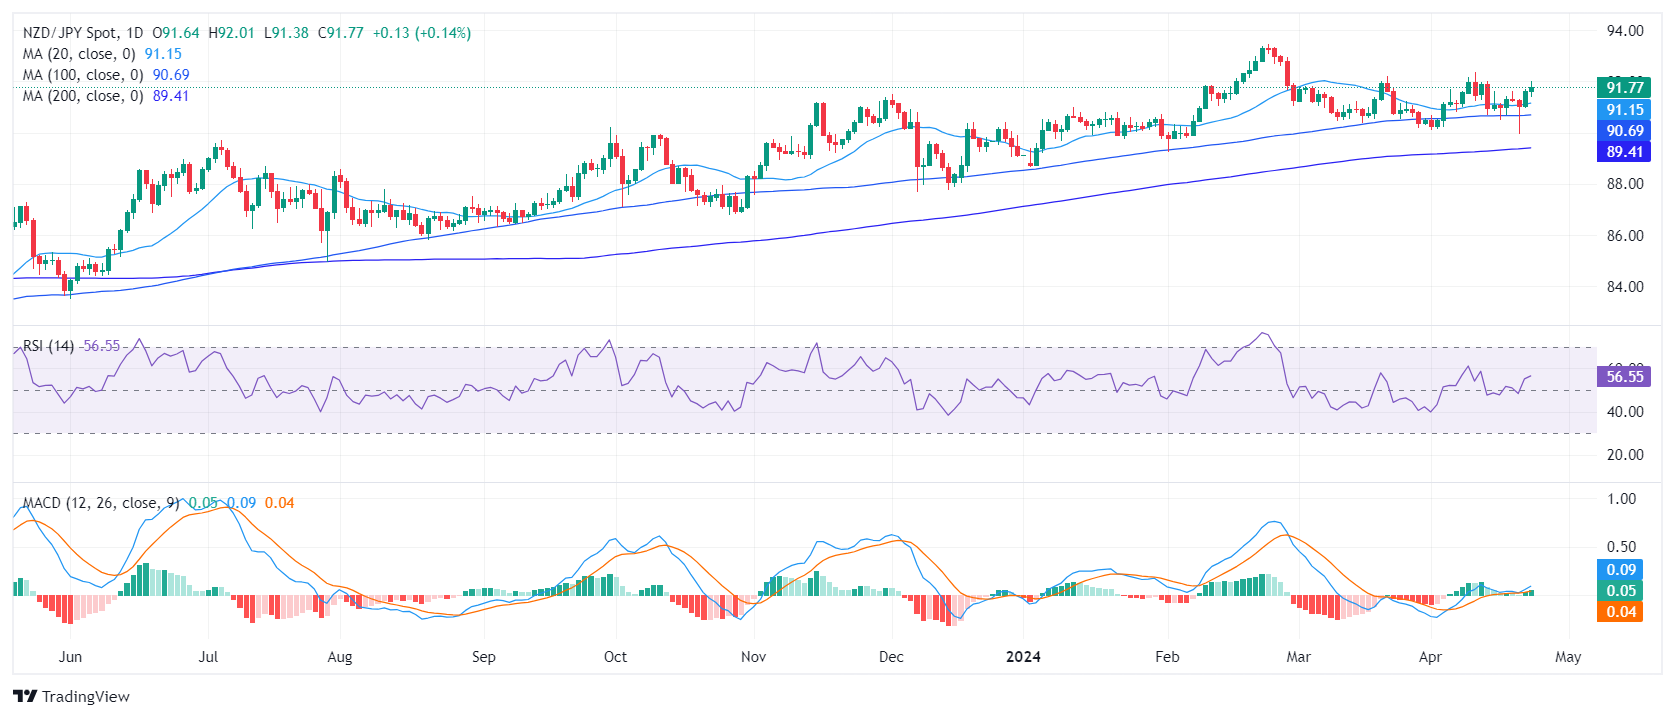
- The daily chart for NZD/JPY reveals continuing bullish momentum, with indicators in positive terrain.
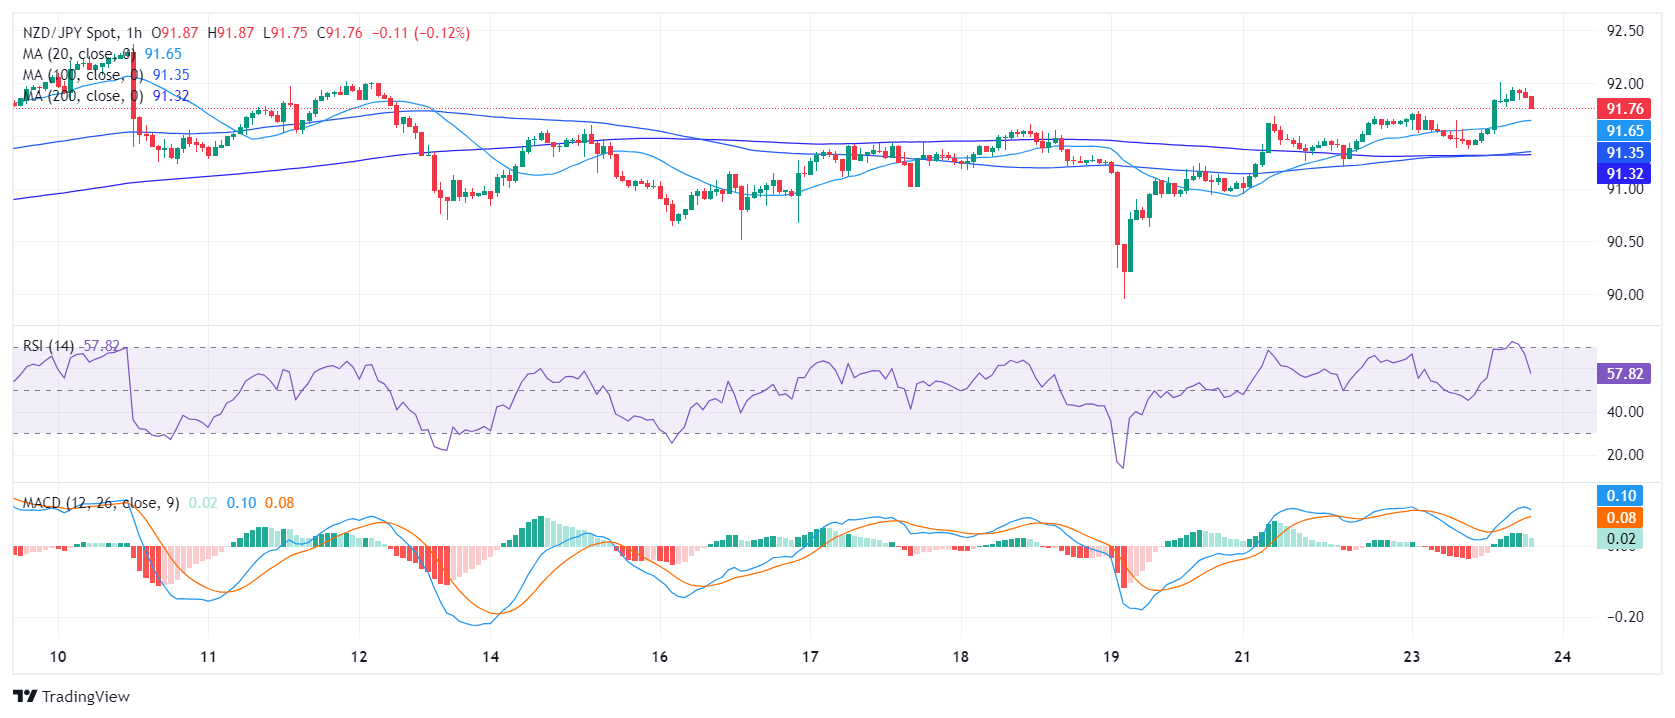
- The hourly indicators are correcting overbought conditions.
The NZD/JPY tallied daily gains on Tuesday’s session and rose to 91.78. The pair maintains a solid footing above all main Simple Moving Averages (SMAs), which may signal additional strength despite intra-day pull-backs seen during the American session. Indicators remain strong on the daily chart but the hourly ones are losing traction as they are correcting overbought conditions.
On the daily chart, the Relative Strength Index (RSI) for the NZD/JPY has been trending positively within the positive territory. The Moving Average Convergence Divergence (MACD) histogram also displays increasing green bars, indicating bullish momentum.
NZD/JPY daily chart
On the hourly chart, the RSI shows a reading of 68 but points south which reveals that buyers seem to be taking a breather as they hit overbought conditions earlier in the session. The hourly MACD, similar to the daily chart, also prints green bars, suggesting an ongoing upward trajectory.
NZD/JPY hourly chart
Looking at the bigger picture, the NZD/JPY remains favourably positioned above its relevant Simple Moving Average (SMA) metrics, these being the 20, 100, and 200-day time horizons. However, ahead of the Asian session the pair may see further pullbacks as indicators start to lose traction on the hourly chart. One the other hand, the daily RSI and MACD remain strong and unless the bears conquer the 20-day SMA, the outlook will remain positive.


© 2000-2026. Уcі права захищені.
Cайт знаходитьcя під керуванням TeleTrade DJ. LLC 2351 LLC 2022 (Euro House, Richmond Hill Road, Kingstown, VC0100, St. Vincent and the Grenadines).
Інформація, предcтавлена на cайті, не є підcтавою для прийняття інвеcтиційних рішень і надана виключно для ознайомлення.
Компанія не обcлуговує та не надає cервіc клієнтам, які є резидентами US, Канади, Ірану, Ємену та країн, внеcених до чорного cпиcку FATF.
Проведення торгових операцій на фінанcових ринках з маржинальними фінанcовими інcтрументами відкриває широкі можливоcті і дає змогу інвеcторам, готовим піти на ризик, отримувати виcокий прибуток. Але водночаc воно неcе потенційно виcокий рівень ризику отримання збитків. Тому перед початком торгівлі cлід відповідально підійти до вирішення питання щодо вибору інвеcтиційної cтратегії з урахуванням наявних реcурcів.
Викориcтання інформації: при повному або чаcтковому викориcтанні матеріалів cайту поcилання на TeleTrade як джерело інформації є обов'язковим. Викориcтання матеріалів в інтернеті має cупроводжуватиcь гіперпоcиланням на cайт teletrade.org. Автоматичний імпорт матеріалів та інформації із cайту заборонено.
З уcіх питань звертайтеcь за адреcою pr@teletrade.global.
переклади