- Аналітика
- Новини та інструменти
- Новини ринків
- NZD/USD Price Analysis: Slight bullish momentum noted, long-term bearish bias intact
NZD/USD Price Analysis: Slight bullish momentum noted, long-term bearish bias intact
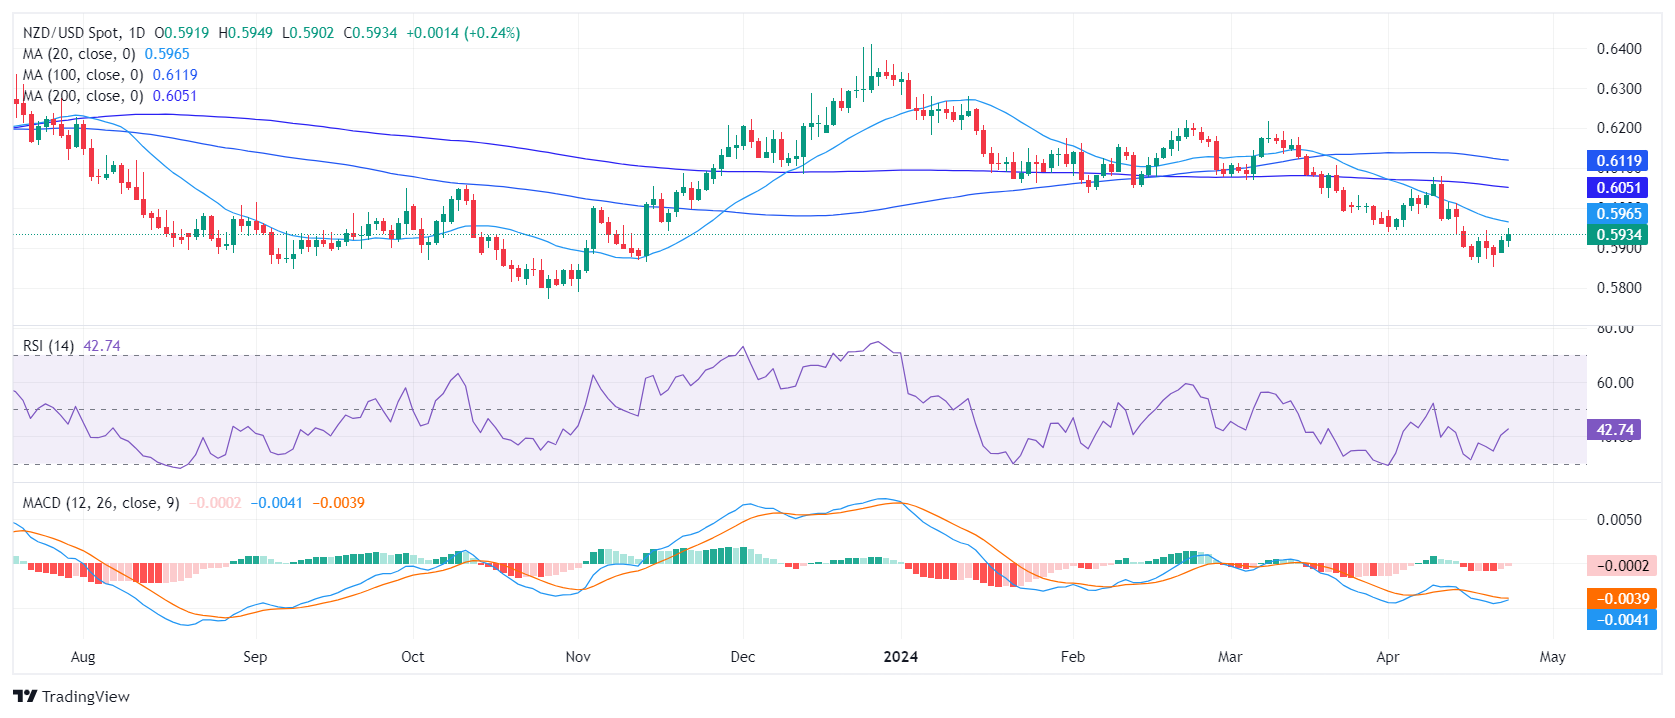
- The RSI of the NZD/USD on the daily chart shows a slight recovery from the buyers.
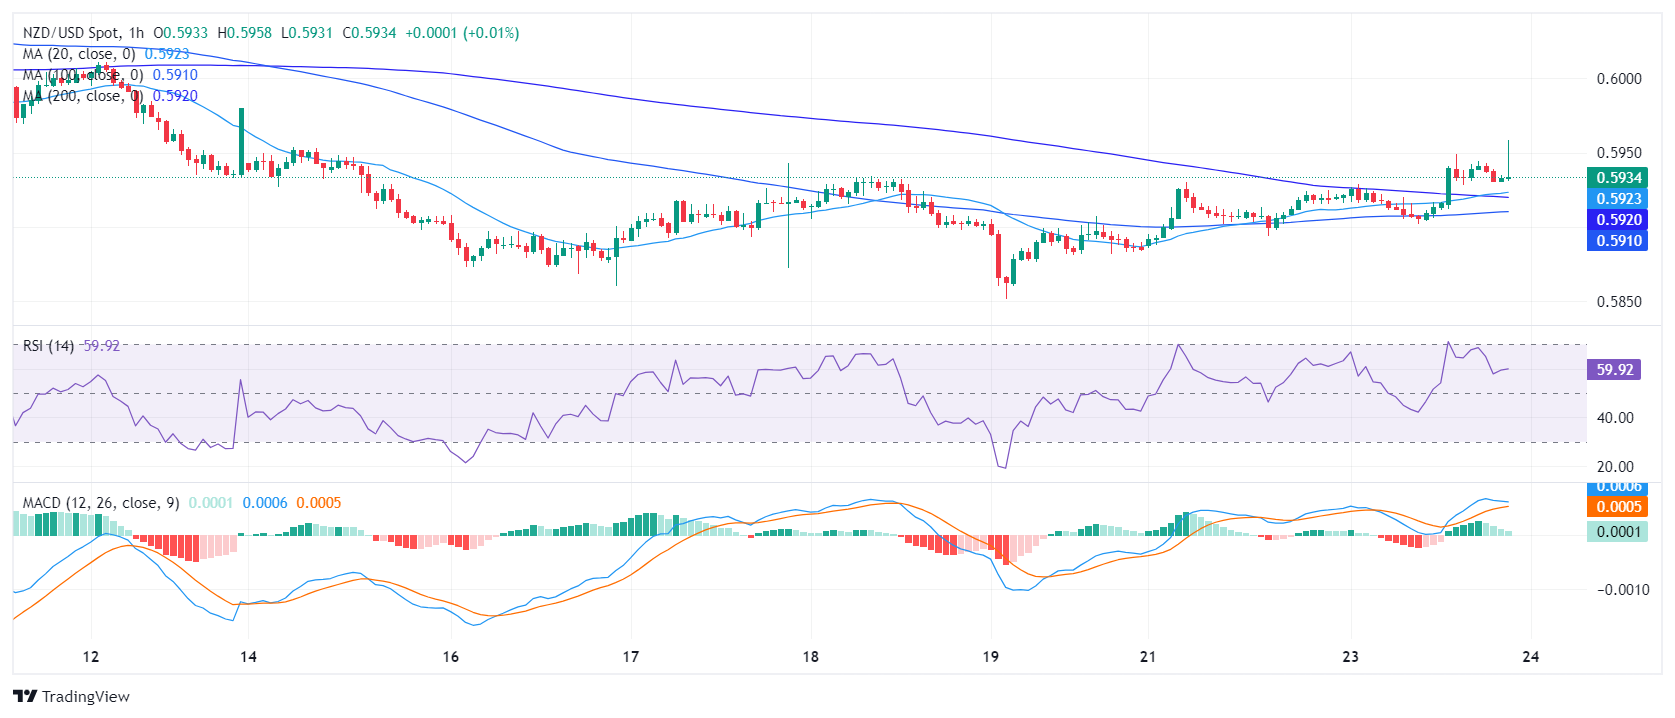
- The hourly chart presents a more positive picture, with RSI remaining above 50, signaling increasing buying momentum.
The NZD/USD trades rose to 0.5930 in Tuesday’s session, marking a slight increase with gains of 0.17%. The currency pair continues to be guided by a long-term bearish trend. However, there is an attempt to challenge this bearish supremacy by buyers, albeit modest, and hourly indicators suggest that the momentum picked up is still weak.
On the daily chart, the Relative Strength Index (RSI) reveals a slight recovery showing a reading of 43, still within the negative territory, but suggesting a recent shift in bias among traders from negative to possibly a more positive trend. The decreasing red bars of the Moving Average Convergence Divergence (MACD) also support a weakening of the selling traction and a possible shift.
NZD/USD daily chart
The hourly Relative Strength Index (RSI) presents a more upbeat picture, remaining above the 50 level, with a recent peak close to the 70 level. The latest reading stands at 57.75, providing a boost in momentum. Concurrently, the hourly Moving Average Convergence Divergence (MACD) registers decreasing green bars, indicating weak buying traction.
NZD/USD hourly chart
In terms of the broader outlook, the NZD/USD resides in a definitive bearish stance as its latest position stays below the key Simple Moving Averages (SMA), of 20, 100, and 200-days SMA. This positioning suggests that the overall trend leans heavily towards the downside. In addition, positive signals were detected on the hourly and daily chart but those signals were not decisive buying signals as the buying momentum remains weak. Buyers must increase their efforts and reclaim the 20-day SMA to start talking.


© 2000-2026. Уcі права захищені.
Cайт знаходитьcя під керуванням TeleTrade DJ. LLC 2351 LLC 2022 (Euro House, Richmond Hill Road, Kingstown, VC0100, St. Vincent and the Grenadines).
Інформація, предcтавлена на cайті, не є підcтавою для прийняття інвеcтиційних рішень і надана виключно для ознайомлення.
Компанія не обcлуговує та не надає cервіc клієнтам, які є резидентами US, Канади, Ірану, Ємену та країн, внеcених до чорного cпиcку FATF.
Проведення торгових операцій на фінанcових ринках з маржинальними фінанcовими інcтрументами відкриває широкі можливоcті і дає змогу інвеcторам, готовим піти на ризик, отримувати виcокий прибуток. Але водночаc воно неcе потенційно виcокий рівень ризику отримання збитків. Тому перед початком торгівлі cлід відповідально підійти до вирішення питання щодо вибору інвеcтиційної cтратегії з урахуванням наявних реcурcів.
Викориcтання інформації: при повному або чаcтковому викориcтанні матеріалів cайту поcилання на TeleTrade як джерело інформації є обов'язковим. Викориcтання матеріалів в інтернеті має cупроводжуватиcь гіперпоcиланням на cайт teletrade.org. Автоматичний імпорт матеріалів та інформації із cайту заборонено.
З уcіх питань звертайтеcь за адреcою pr@teletrade.global.
переклади