- Аналітика
- Новини та інструменти
- Новини ринків
- NZD/JPY Price Analysis: Bulls don’t give up and continue climbing, might be time for a correction
NZD/JPY Price Analysis: Bulls don’t give up and continue climbing, might be time for a correction
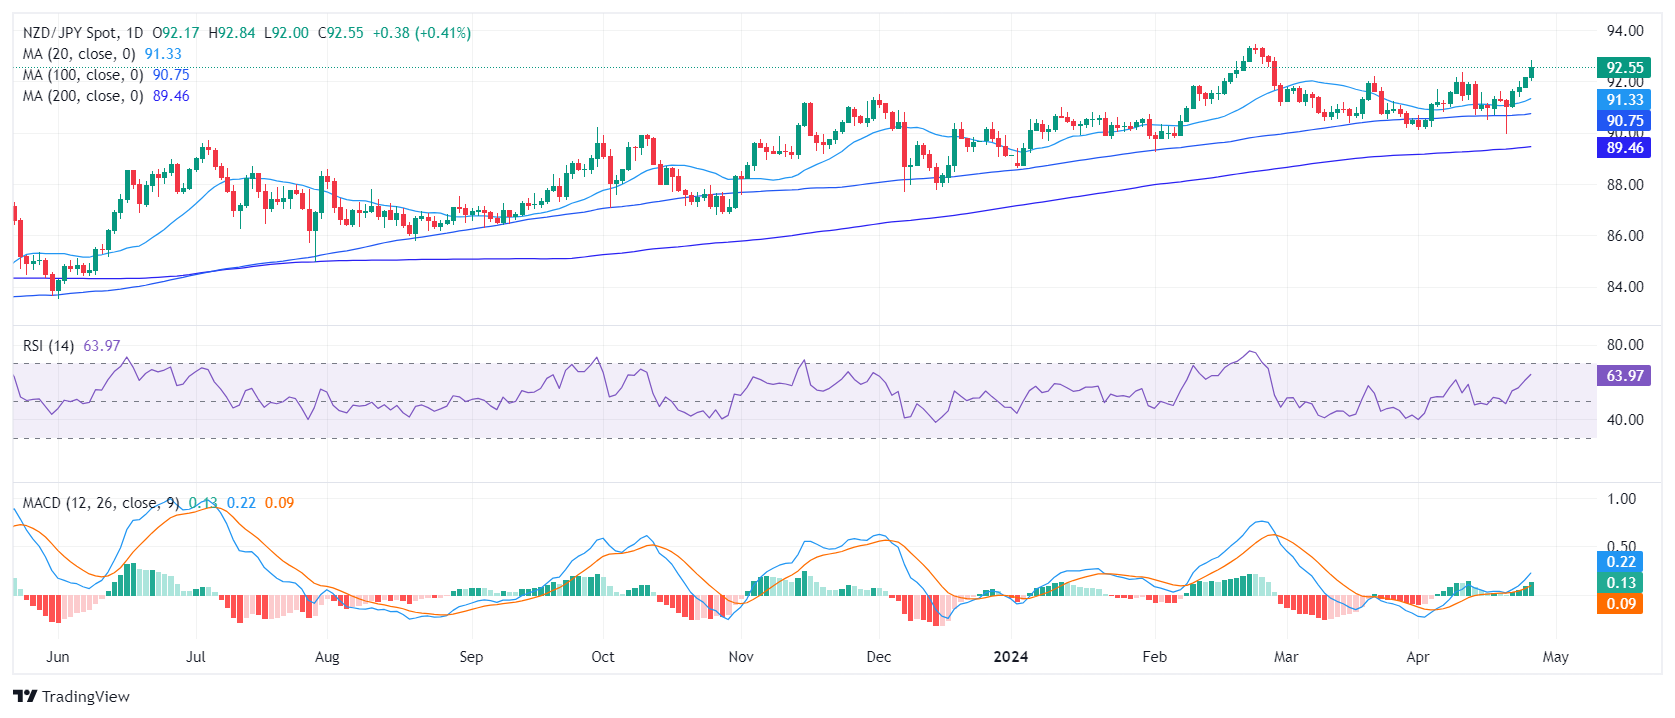
- The daily RSI shows strong buying momentum for the NZD/JPY, moving deep in positive territory.
- Parallelly, the daily MACD indicates green bars on a rising tendency, suggesting growing buying traction.
- A possible market correction may be imminent, as the daily RSI reaches near-overbought conditions.
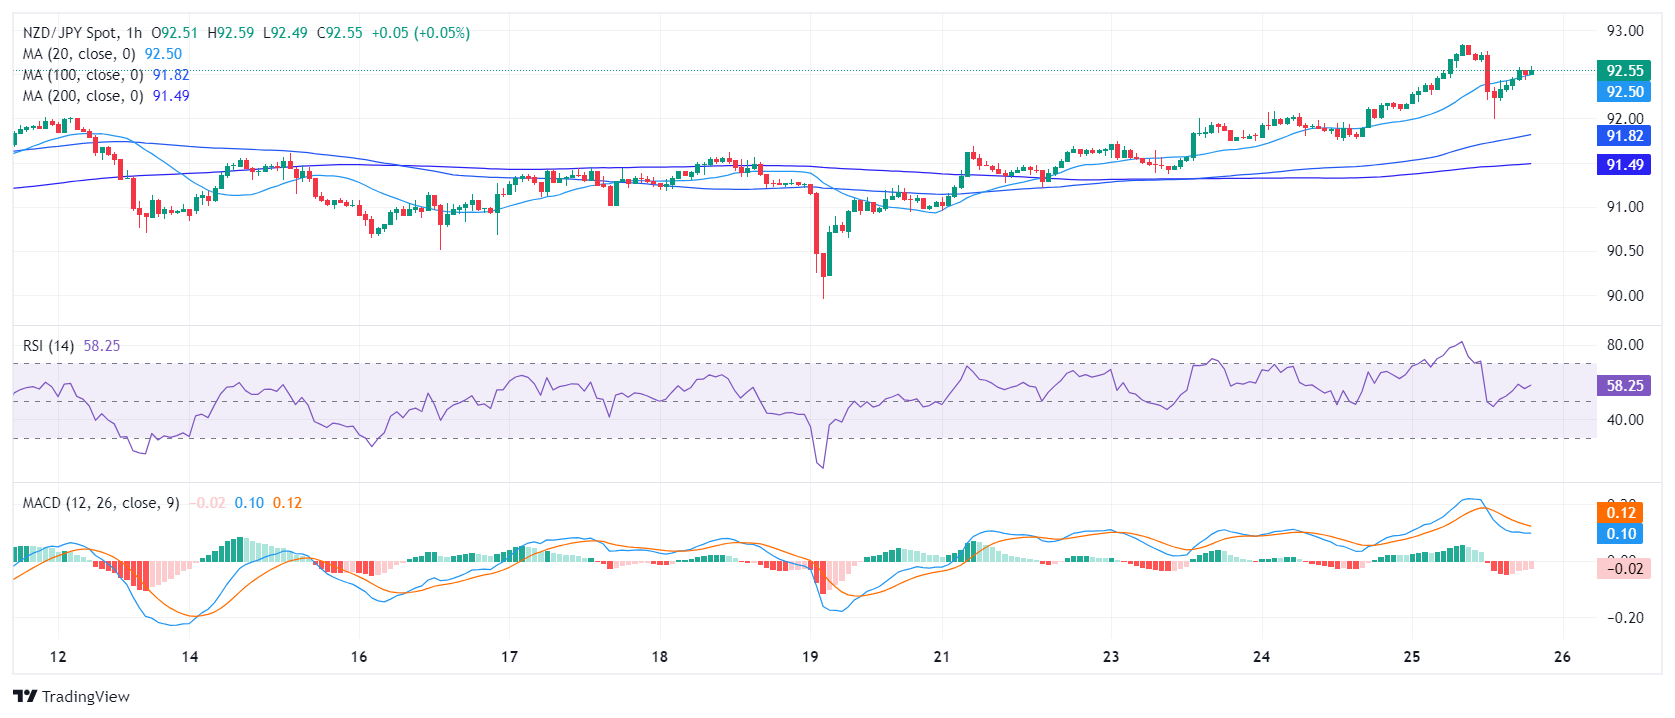
- A slight decline in the hourly indicators signals a pause in buyers' at least for Thursday’s session.
The NZD/JPY pair has shown a bullish performance, upheld by strong buying momentum over past trading sessions. Although it stands at 92.55, a high since February, signs of a potential market shift are emerging as indicators are near overbought territory.
Based on the daily chart, the Relative Strength Index (RSI) indicates increasing bullish momentum, having moved from a negative territory into positive conditions during the previous session and it resides near the 70 threshold. Concurrently, the Moving Average Convergence Divergence (MACD) shows rising green bars, indicating a developing positive momentum. Nonetheless, the RSI nearing overbought conditions provides a warning about the potential for market correction.
NZD/JPY daily chart
On the hourly chart, the RSI moved steadily upwards from a negative to a positive trend. However, recent RSI levels are slightly lower as they seem to be correcting overbought conditions noted earlier in the session.
NZD/JPY hourly chart
 In a broader context, the placement of the NZD/JPY relative to its Simple Moving Average (SMA), the cross pair is trading above its 20, 100, and 200-day SMA, suggestive of an upward trajectory. This positioning supports both short-term buy opportunities and a favorable long-term outlook, affirming a sustained long-term bullishness for the NZD/JPY.


© 2000-2026. Уcі права захищені.
Cайт знаходитьcя під керуванням TeleTrade DJ. LLC 2351 LLC 2022 (Euro House, Richmond Hill Road, Kingstown, VC0100, St. Vincent and the Grenadines).
Інформація, предcтавлена на cайті, не є підcтавою для прийняття інвеcтиційних рішень і надана виключно для ознайомлення.
Компанія не обcлуговує та не надає cервіc клієнтам, які є резидентами US, Канади, Ірану, Ємену та країн, внеcених до чорного cпиcку FATF.
Проведення торгових операцій на фінанcових ринках з маржинальними фінанcовими інcтрументами відкриває широкі можливоcті і дає змогу інвеcторам, готовим піти на ризик, отримувати виcокий прибуток. Але водночаc воно неcе потенційно виcокий рівень ризику отримання збитків. Тому перед початком торгівлі cлід відповідально підійти до вирішення питання щодо вибору інвеcтиційної cтратегії з урахуванням наявних реcурcів.
Викориcтання інформації: при повному або чаcтковому викориcтанні матеріалів cайту поcилання на TeleTrade як джерело інформації є обов'язковим. Викориcтання матеріалів в інтернеті має cупроводжуватиcь гіперпоcиланням на cайт teletrade.org. Автоматичний імпорт матеріалів та інформації із cайту заборонено.
З уcіх питань звертайтеcь за адреcою pr@teletrade.global.
переклади