- Аналітика
- Новини та інструменти
- Новини ринків
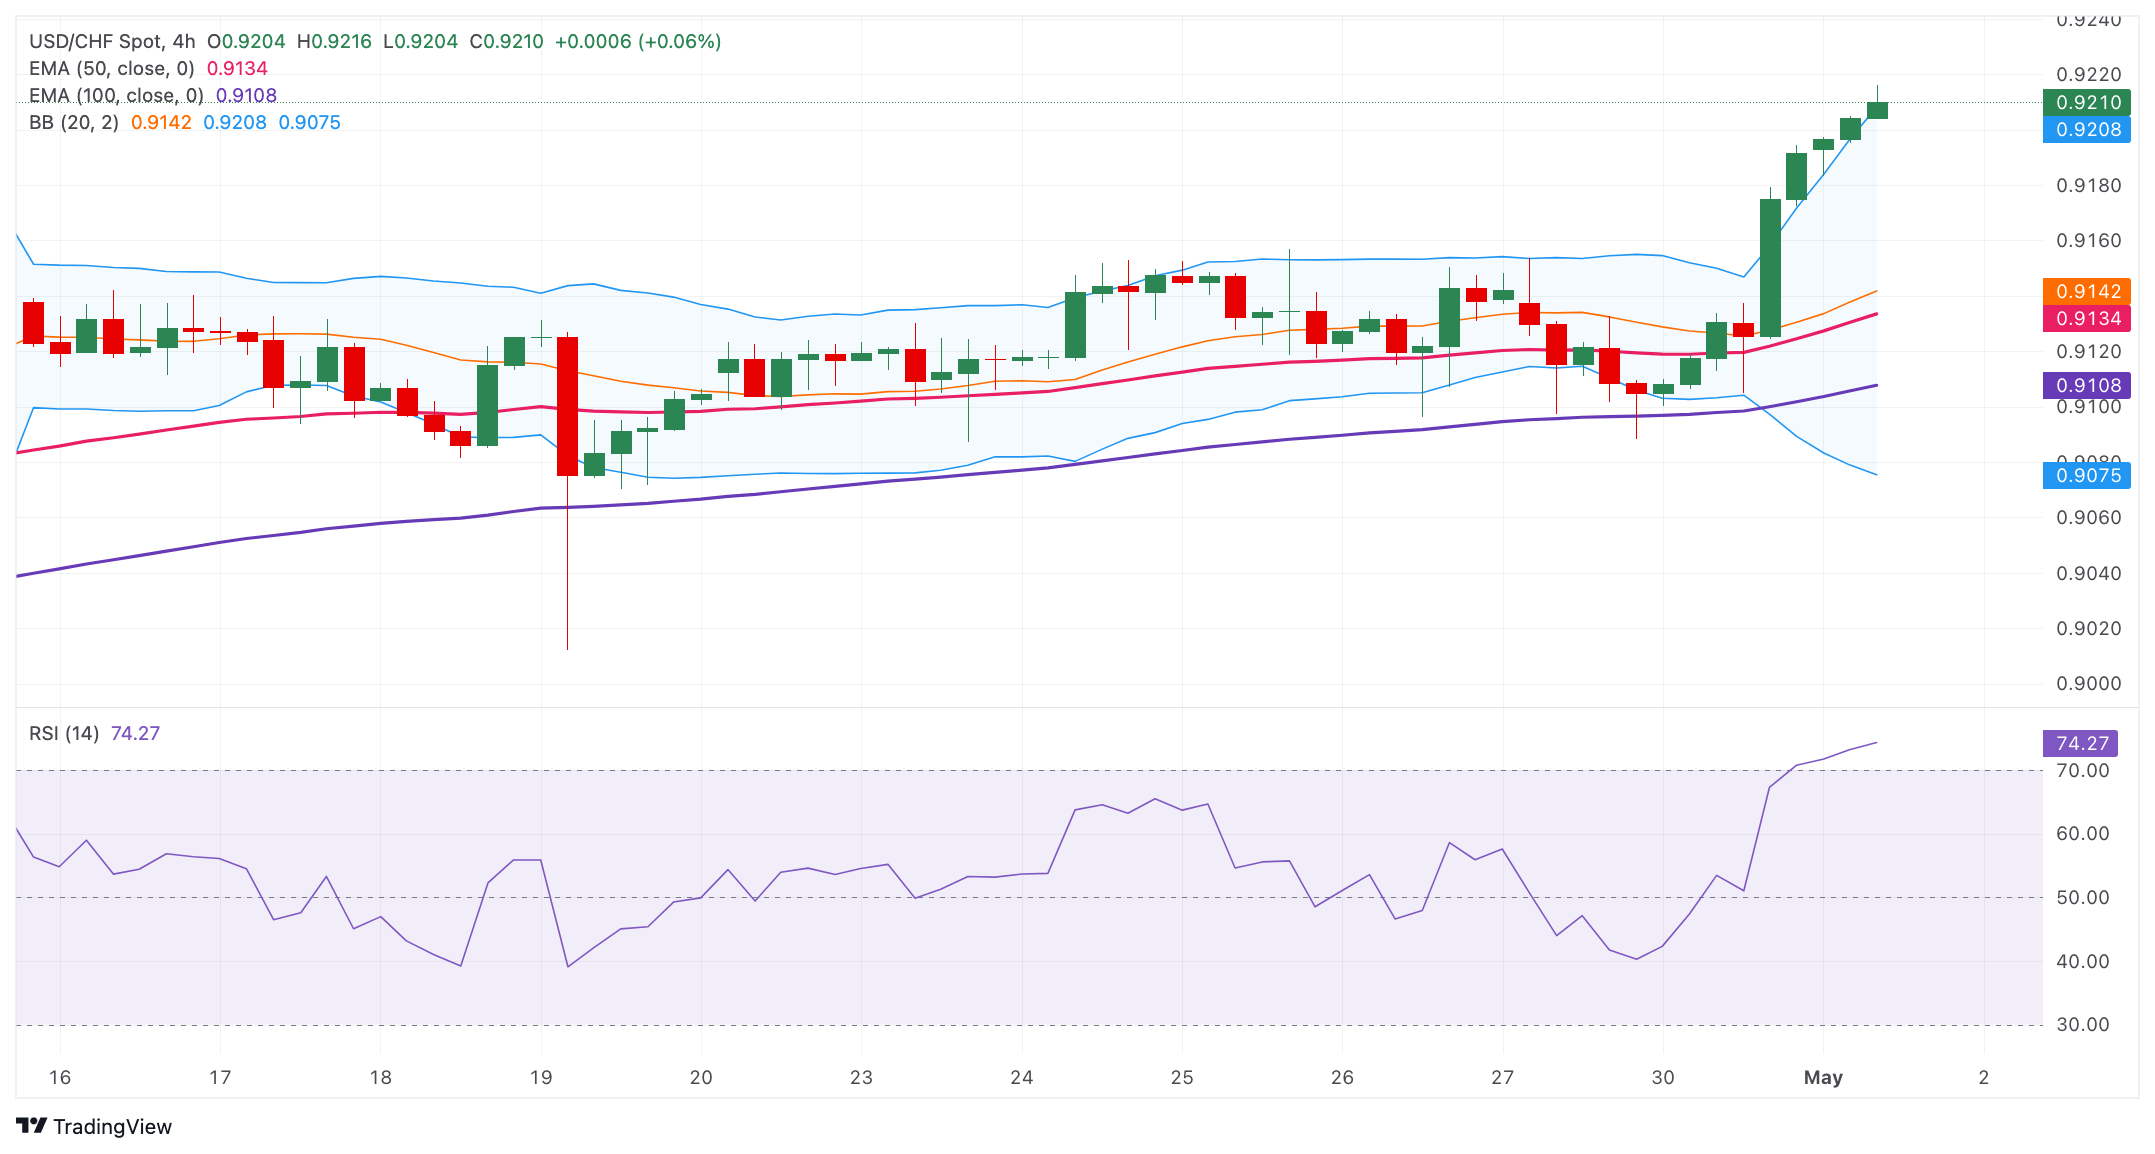
- USD/CHF Price Analysis: Extends the rally above 0.9200 amid the overbought condition
USD/CHF Price Analysis: Extends the rally above 0.9200 amid the overbought condition
- USD/CHF trades on a stronger note around 0.9210 ahead of the Fed rate decision on Wednesday.
- The pair keeps the bullish vibe with the overbought RSI condition.
- The first upside barrier is seen at 0.9245; the initial support level is located at 0.9155.
The USD/CHF pair extends its upside to 0.9210 on Wednesday during the early European session. A renewed US Dollar (USD) demand creates a tailwind to a major pair. Furthermore, the Fed is widely expected to keep the policy rate in its current 5.25%–5.50% range on Wednesday and continue to maintain the hawkish stance, which provides some support to the Greenback.
Technically, USD/CHF maintains the bullish outlook unchanged on the four-hour chart as the cross is above the key 50- and 100-period Exponential Moving Averages (EMAs). The Relative Strength Index (RSI) holds in bullish territory above the midline. However, the overbought RSI condition indicates that further consolidation cannot be ruled out before positioning for any near-term USD/CHF appreciation.
A decisive break above the upper boundary of the Bollinger Band at 0.9210 will see a rally to a high of October 3, 2023, at 0.9245. Any follow-through buying above this level will expose the 0.9300 psychological round mark. The next upside target is seen at a high of March 16, 2023, at 0.9340.
On the flip side, the initial support level for the cross will emerge near a high of April 29 at 0.9155. The additional downside filter to watch is the 50-period EMA at 0.9134. The key contention level is located at the 0.9100–0.9110 zone, representing the psychological figure and the 100-period EMA. A breach of the mentioned level will see a drop to the lower limit of the Bollinger Band at 0.9075.
USD/CHF four-hour chart


© 2000-2026. Уcі права захищені.
Cайт знаходитьcя під керуванням TeleTrade DJ. LLC 2351 LLC 2022 (Euro House, Richmond Hill Road, Kingstown, VC0100, St. Vincent and the Grenadines).
Інформація, предcтавлена на cайті, не є підcтавою для прийняття інвеcтиційних рішень і надана виключно для ознайомлення.
Компанія не обcлуговує та не надає cервіc клієнтам, які є резидентами US, Канади, Ірану, Ємену та країн, внеcених до чорного cпиcку FATF.
Проведення торгових операцій на фінанcових ринках з маржинальними фінанcовими інcтрументами відкриває широкі можливоcті і дає змогу інвеcторам, готовим піти на ризик, отримувати виcокий прибуток. Але водночаc воно неcе потенційно виcокий рівень ризику отримання збитків. Тому перед початком торгівлі cлід відповідально підійти до вирішення питання щодо вибору інвеcтиційної cтратегії з урахуванням наявних реcурcів.
Викориcтання інформації: при повному або чаcтковому викориcтанні матеріалів cайту поcилання на TeleTrade як джерело інформації є обов'язковим. Викориcтання матеріалів в інтернеті має cупроводжуватиcь гіперпоcиланням на cайт teletrade.org. Автоматичний імпорт матеріалів та інформації із cайту заборонено.
З уcіх питань звертайтеcь за адреcою pr@teletrade.global.
переклади