- Аналітика
- Новини та інструменти
- Новини ринків
- GBP/JPY Price Analysis: Bulls maintain stronghold, despite profit take-off
GBP/JPY Price Analysis: Bulls maintain stronghold, despite profit take-off
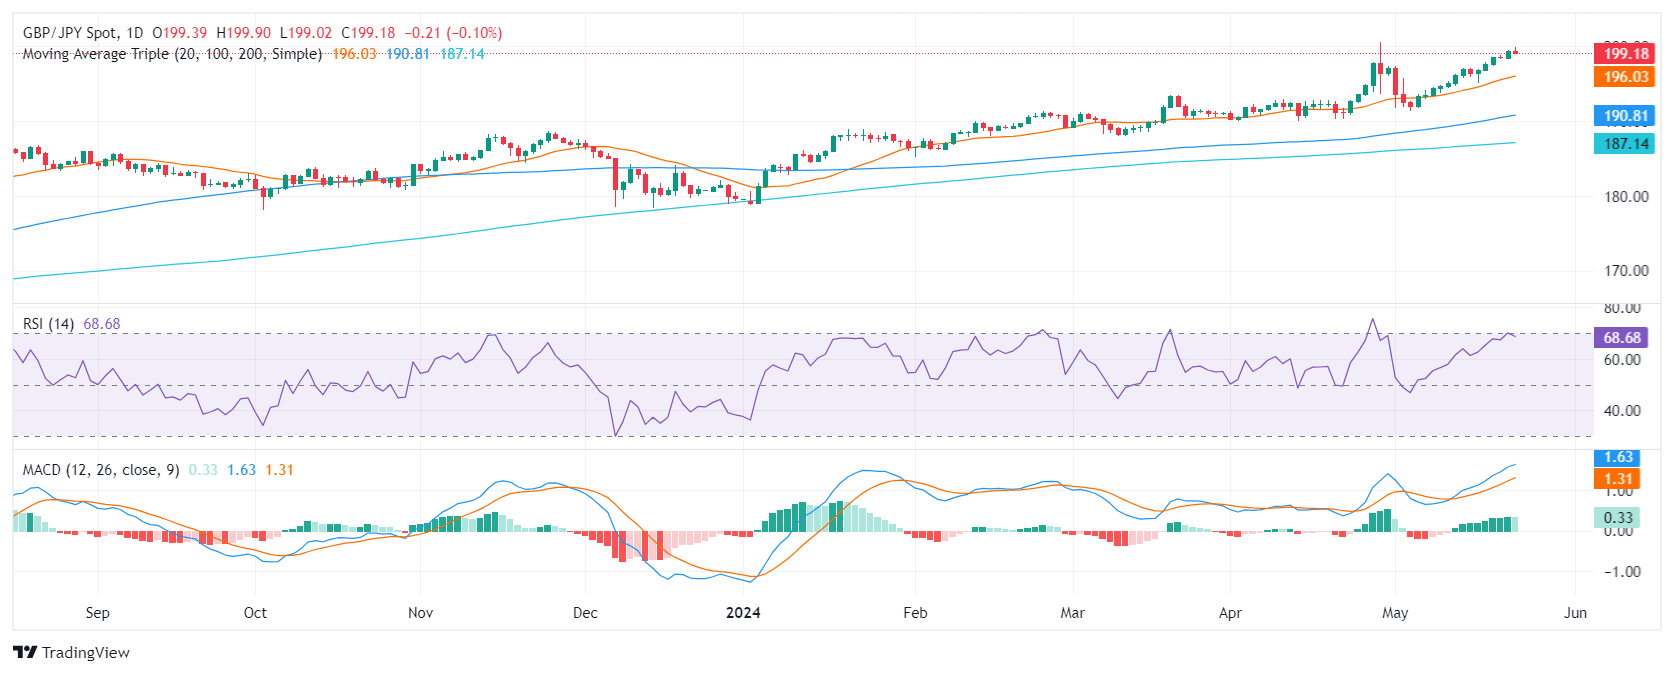
- The daily chart shows that the bulls are taking their foot off the gas and started to take profits.
- The hourly chart shows signs of short-term selling pressure ahead of the Asian session.
- The main support to hold is the 20-day SMA at 196.00.
On Thursday's session, the GBP/JPY declined to 199.20 but holds an overall positive outlook. This theory is backed up by the pair approaching near-cycle highs. If the cross holds the 20-day Simple Moving Average (SMA) at 196.00, the downward movements could be considered corrective.
In the daily chart, the Relative Strength Index (RSI) exhibits heightened bullish momentum as it comfortably resides in positive territory nearing overbought conditions but seems to be flattening. Simultaneously, the Moving Average Convergence Divergence (MACD) reveals a decreasing bullish momentum, distinguished by falling green bars. This indicates that while buyers currently hold the reins, their influence may be abating.
GBP/JPY daily chart
Switching to the hourly chart, the RSI portrays a contrasting bearish tendency, with the latest reading of approximately 44, dipping into negative territory. A declining trend is corroborated by the MACD's ascending red bars, suggesting a surge in negative momentum as sellers gain influence in the short term.
GBP/JPY hourly chart
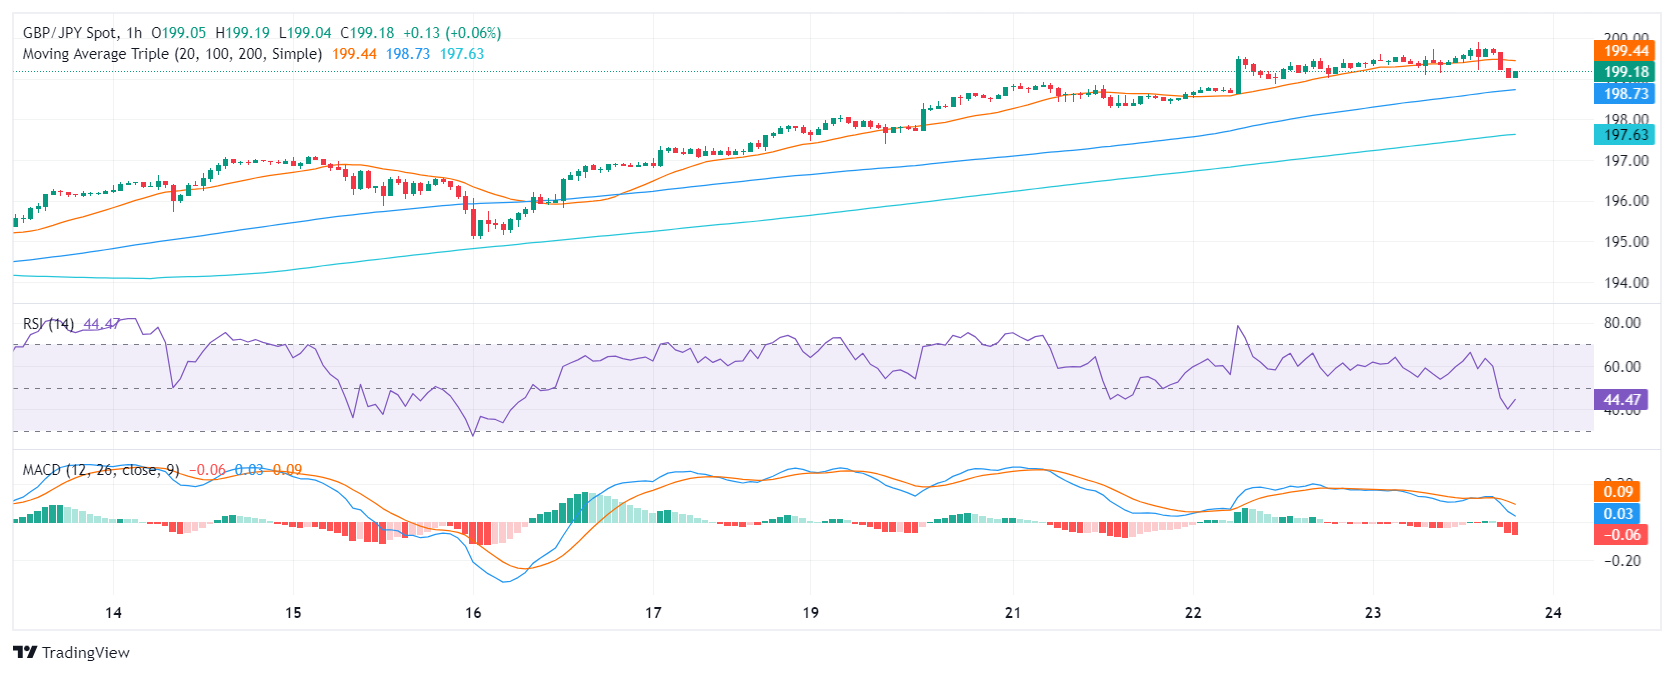
To conclude, the GBP/JPY pair rose near cycle highs, and indicators reached overbought conditions which may trigger a corrective phase. Ahead of the Asian session, investors are taking profits, evident in the hourly chart where indicators are in the red. However, as long as the pair holds above the 20,100 and 200-day SMAs, the outlook will be bullish.


© 2000-2026. Уcі права захищені.
Cайт знаходитьcя під керуванням TeleTrade DJ. LLC 2351 LLC 2022 (Euro House, Richmond Hill Road, Kingstown, VC0100, St. Vincent and the Grenadines).
Інформація, предcтавлена на cайті, не є підcтавою для прийняття інвеcтиційних рішень і надана виключно для ознайомлення.
Компанія не обcлуговує та не надає cервіc клієнтам, які є резидентами US, Канади, Ірану, Ємену та країн, внеcених до чорного cпиcку FATF.
Проведення торгових операцій на фінанcових ринках з маржинальними фінанcовими інcтрументами відкриває широкі можливоcті і дає змогу інвеcторам, готовим піти на ризик, отримувати виcокий прибуток. Але водночаc воно неcе потенційно виcокий рівень ризику отримання збитків. Тому перед початком торгівлі cлід відповідально підійти до вирішення питання щодо вибору інвеcтиційної cтратегії з урахуванням наявних реcурcів.
Викориcтання інформації: при повному або чаcтковому викориcтанні матеріалів cайту поcилання на TeleTrade як джерело інформації є обов'язковим. Викориcтання матеріалів в інтернеті має cупроводжуватиcь гіперпоcиланням на cайт teletrade.org. Автоматичний імпорт матеріалів та інформації із cайту заборонено.
З уcіх питань звертайтеcь за адреcою pr@teletrade.global.
переклади