- Аналітика
- Новини та інструменти
- Новини ринків
- AUD/USD tumbles to six-day low and hovers around 0.6600
AUD/USD tumbles to six-day low and hovers around 0.6600
- AUD/USD falls 0.20% to 0.6605, continuing its third day of losses.
- US economic resurgence evident with S&P Global Composite PMI at a 12-month high of 54.4.
- Strong US Services PMI at 54.8 and Manufacturing PMI at 50.9 dampen hopes for a Fed rate cut.
The Australian Dollar lost 0.20% against the US Dollar for the third straight day on Thursday as investors digested the latest S&P Global PMI report in the US, hinting the economy is reaccelerating. Consequently, Federal Reserve rate cut hopes were hurt, with traders expecting 27 basis points of easing toward the end of the year. The AUD/USD trades at 0.6605, virtually unchanged.
Aussie Dollar slumped as the Greenback got underpinned by strong PMIs
Wall Street ended the session with losses. US Treasury bond yields jumped following the release of the S&P Global Composite PMI, rising to 54.4, its highest level in twelve months. The Services PMI rose to 54.8, its highest level since October 2022, while the Manufacturing PMI expanded by 50.9, exceeding estimates and forecasts of 50.0.
The data propelled the AUD/USD from around 0.6650 toward 0.6618 on the data release. Earlier, the US Department of Labor (DOL) revealed that Initial Jobless Claims rose less than expected, to 215K, below 220K, and much less than the 223K of the previous reading.
Thursday data, along with the latest FOMC minutes, revealed that Fed officials are ready to tighten policy “should risks to outlook materialize and make such action appropriate.” They added that the disinflation process “would take longer than previously anticipated,” warranting higher rates for longer.
On the Aussie’s front, Thursday’s economic docket featured the release of the Judo Bank Manufacturing and Services PMIs final readings for May. The Services PMI came at 49.6, unchanged while the Manufacturing PMI stood at 53.1, lower than the 53.6 on its preliminary release.
AUD/USD Price Analysis: Technical outlook
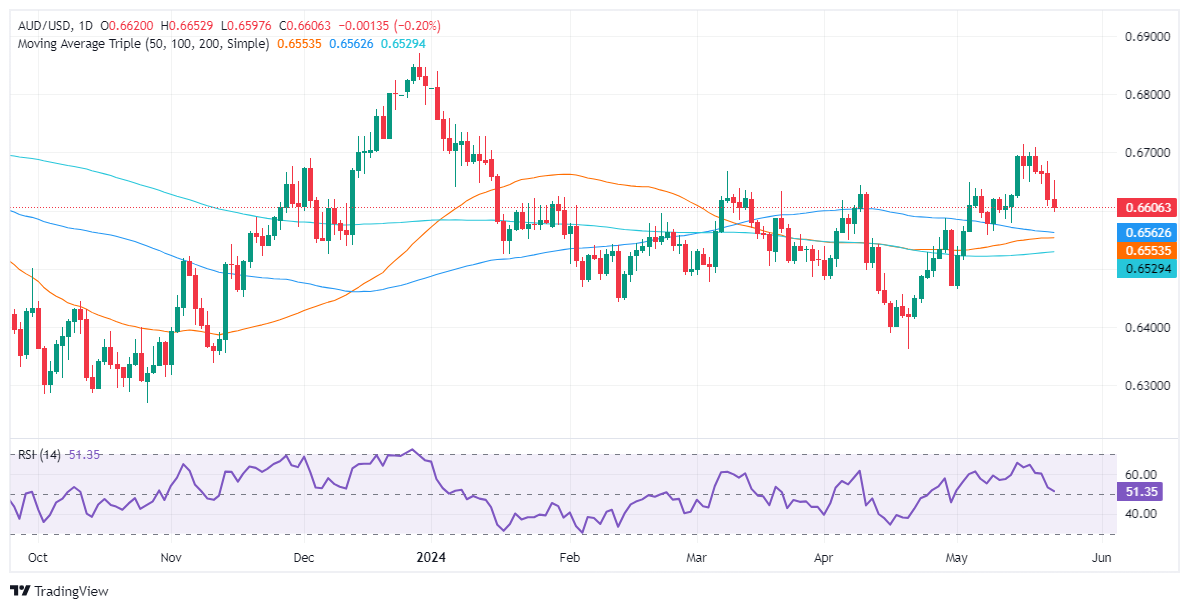
After trading within a narrow range of 0.6640-0.6700, the AUD/USD broke below the bottom of the range and extended its losses towards the 0.6610 region. Buyers appear to be losing momentum, as indicated by the Relative Strength Index (RSI) flattening out despite being in bullish territory, suggesting potential for lower price levels.
The first support for AUD/USD is at 0.6600. If this level is breached, it will expose the 100-day moving average (DMA) at 0.6562, followed by the 50 and 200-DMAs at 0.6553 and 0.6526, respectively. Conversely, if buyers regain control and push prices above 0.6640, it could pave the way towards 0.6700.
Australian Dollar PRICE This week
The table below shows the percentage change of Australian Dollar (AUD) against listed major currencies this week. Australian Dollar was the strongest against the Japanese Yen.
| USD | EUR | GBP | JPY | CAD | AUD | NZD | CHF | |
|---|---|---|---|---|---|---|---|---|
| USD | 0.51% | 0.04% | 0.88% | 0.82% | 1.33% | 0.59% | 0.58% | |
| EUR | -0.51% | -0.50% | 0.42% | 0.31% | 0.86% | 0.07% | 0.07% | |
| GBP | -0.04% | 0.50% | 0.78% | 0.82% | 1.35% | 0.56% | 0.56% | |
| JPY | -0.88% | -0.42% | -0.78% | -0.08% | 0.45% | -0.29% | -0.30% | |
| CAD | -0.82% | -0.31% | -0.82% | 0.08% | 0.47% | -0.24% | -0.24% | |
| AUD | -1.33% | -0.86% | -1.35% | -0.45% | -0.47% | -0.79% | -0.78% | |
| NZD | -0.59% | -0.07% | -0.56% | 0.29% | 0.24% | 0.79% | -0.01% | |
| CHF | -0.58% | -0.07% | -0.56% | 0.30% | 0.24% | 0.78% | 0.00% |
The heat map shows percentage changes of major currencies against each other. The base currency is picked from the left column, while the quote currency is picked from the top row. For example, if you pick the Australian Dollar from the left column and move along the horizontal line to the US Dollar, the percentage change displayed in the box will represent AUD (base)/USD (quote).


© 2000-2026. Уcі права захищені.
Cайт знаходитьcя під керуванням TeleTrade DJ. LLC 2351 LLC 2022 (Euro House, Richmond Hill Road, Kingstown, VC0100, St. Vincent and the Grenadines).
Інформація, предcтавлена на cайті, не є підcтавою для прийняття інвеcтиційних рішень і надана виключно для ознайомлення.
Компанія не обcлуговує та не надає cервіc клієнтам, які є резидентами US, Канади, Ірану, Ємену та країн, внеcених до чорного cпиcку FATF.
Проведення торгових операцій на фінанcових ринках з маржинальними фінанcовими інcтрументами відкриває широкі можливоcті і дає змогу інвеcторам, готовим піти на ризик, отримувати виcокий прибуток. Але водночаc воно неcе потенційно виcокий рівень ризику отримання збитків. Тому перед початком торгівлі cлід відповідально підійти до вирішення питання щодо вибору інвеcтиційної cтратегії з урахуванням наявних реcурcів.
Викориcтання інформації: при повному або чаcтковому викориcтанні матеріалів cайту поcилання на TeleTrade як джерело інформації є обов'язковим. Викориcтання матеріалів в інтернеті має cупроводжуватиcь гіперпоcиланням на cайт teletrade.org. Автоматичний імпорт матеріалів та інформації із cайту заборонено.
З уcіх питань звертайтеcь за адреcою pr@teletrade.global.
переклади