- Аналітика
- Новини та інструменти
- Новини ринків
- GBP/JPY Price Analysis: Bulls keep momentum steady, overbought indicators signal near-term correction possible
GBP/JPY Price Analysis: Bulls keep momentum steady, overbought indicators signal near-term correction possible
- The pair rose to highs since 2007 at 199.90.
- The daily RSI indicates an overextended buying momentum, suggesting a pending technical correction.
- The hourly indicators have already started to consolidate.
In Friday’s session, the GBP/JPY pair experienced upward momentum, rising by 0.37% and the pair reached multi-year highs, a clear indication of the stronghold buyers have within the market. While a near-term technical correction could potentially occur due to the overbought condition, the overall outlook remains bullish for the cross.
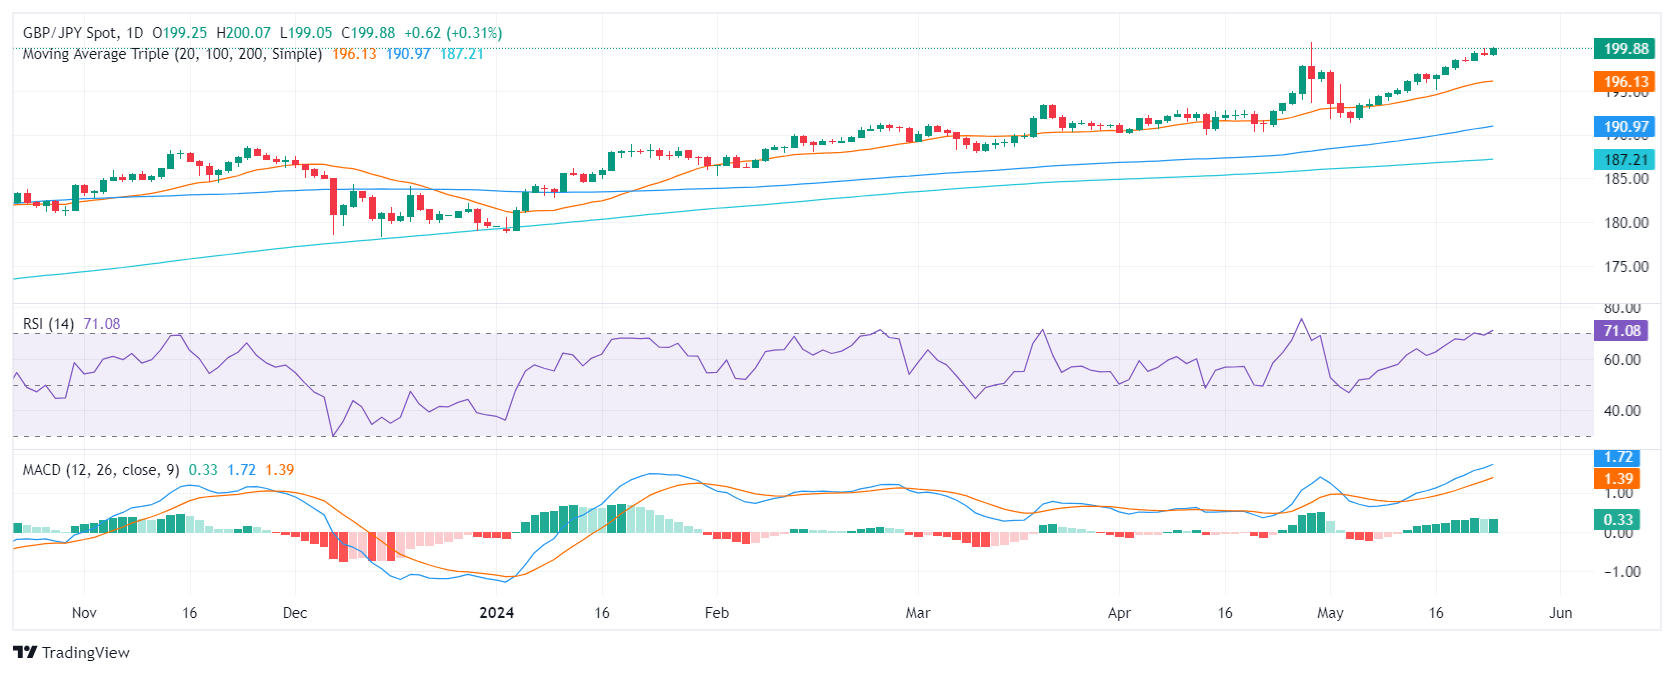
In the daily chart, the Relative Strength Index (RSI) has moved deep into overbought territory. The persistently high values hint at strong buying sentiment, but they also suggest a potential future correction. The Moving Average Convergence Divergence (MACD) reveals flat green bars, indicating positive momentum despite the relatively stable trend which may suggest that the pair might consolidate for the rest of the session.
GBP/JPY daily chart
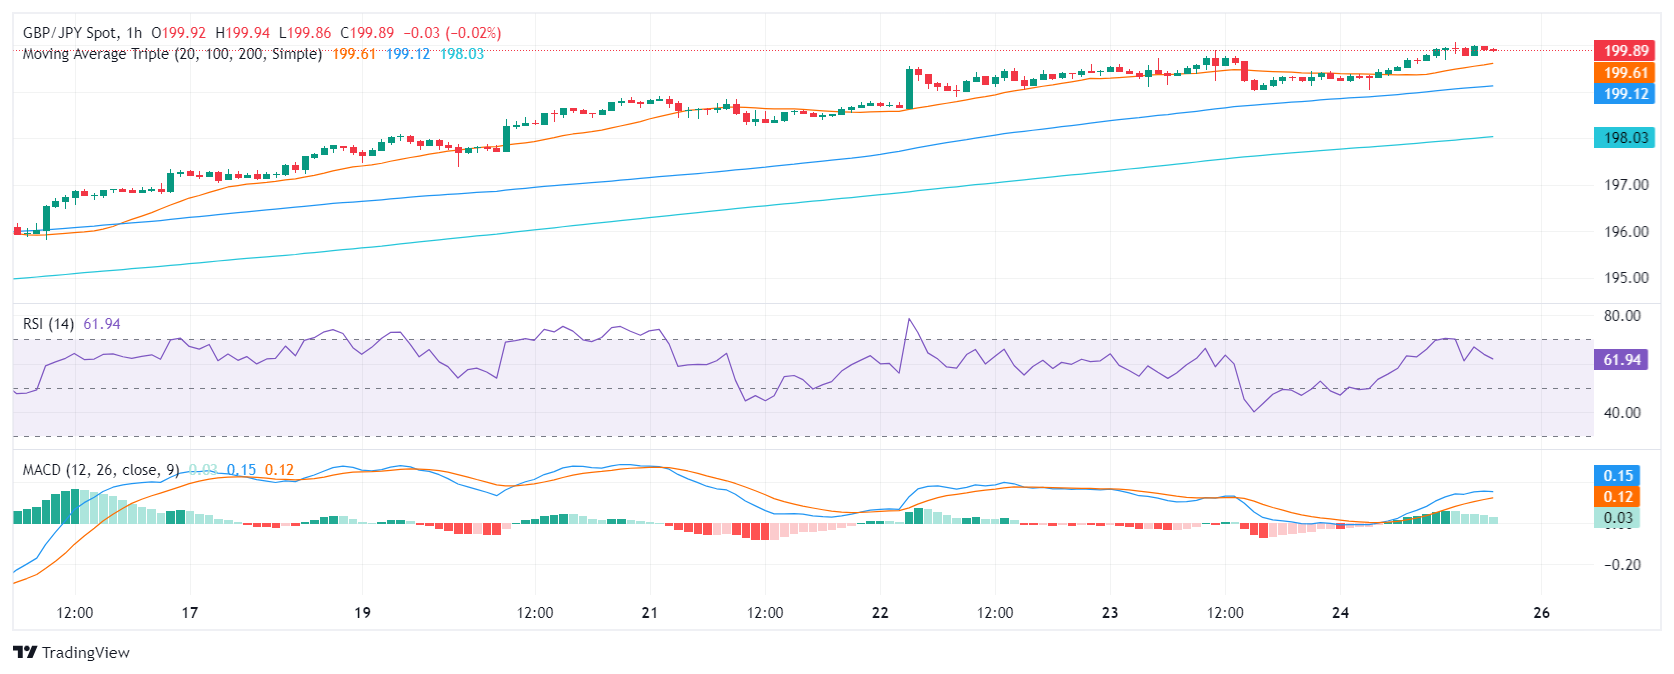
When examining the hourly chart, the RSI reveals noticeable ebbs and flows, with the latest value standing at 61. Although still positive, this level appears somewhat less intense when compared to the daily chart. The hourly MACD histogram continues to display flat green bars, indicating steady positive momentum which mirrors its daily counterpart.
GBP/JPY hourly chart
From a broader outlook, the GBP/JPY's position relative to its Simple Moving Averages (SMAs) helps to clarify the overall trend. The pair stands above the 20, 100, and 200-day SMAs, reflecting a bullish outlook for both short and long-term scenarios.


© 2000-2026. Уcі права захищені.
Cайт знаходитьcя під керуванням TeleTrade DJ. LLC 2351 LLC 2022 (Euro House, Richmond Hill Road, Kingstown, VC0100, St. Vincent and the Grenadines).
Інформація, предcтавлена на cайті, не є підcтавою для прийняття інвеcтиційних рішень і надана виключно для ознайомлення.
Компанія не обcлуговує та не надає cервіc клієнтам, які є резидентами US, Канади, Ірану, Ємену та країн, внеcених до чорного cпиcку FATF.
Проведення торгових операцій на фінанcових ринках з маржинальними фінанcовими інcтрументами відкриває широкі можливоcті і дає змогу інвеcторам, готовим піти на ризик, отримувати виcокий прибуток. Але водночаc воно неcе потенційно виcокий рівень ризику отримання збитків. Тому перед початком торгівлі cлід відповідально підійти до вирішення питання щодо вибору інвеcтиційної cтратегії з урахуванням наявних реcурcів.
Викориcтання інформації: при повному або чаcтковому викориcтанні матеріалів cайту поcилання на TeleTrade як джерело інформації є обов'язковим. Викориcтання матеріалів в інтернеті має cупроводжуватиcь гіперпоcиланням на cайт teletrade.org. Автоматичний імпорт матеріалів та інформації із cайту заборонено.
З уcіх питань звертайтеcь за адреcою pr@teletrade.global.
переклади