- Аналітика
- Новини та інструменти
- Новини ринків
- EUR/AUD Price Forecast: Consolidated at around 1.6200
EUR/AUD Price Forecast: Consolidated at around 1.6200
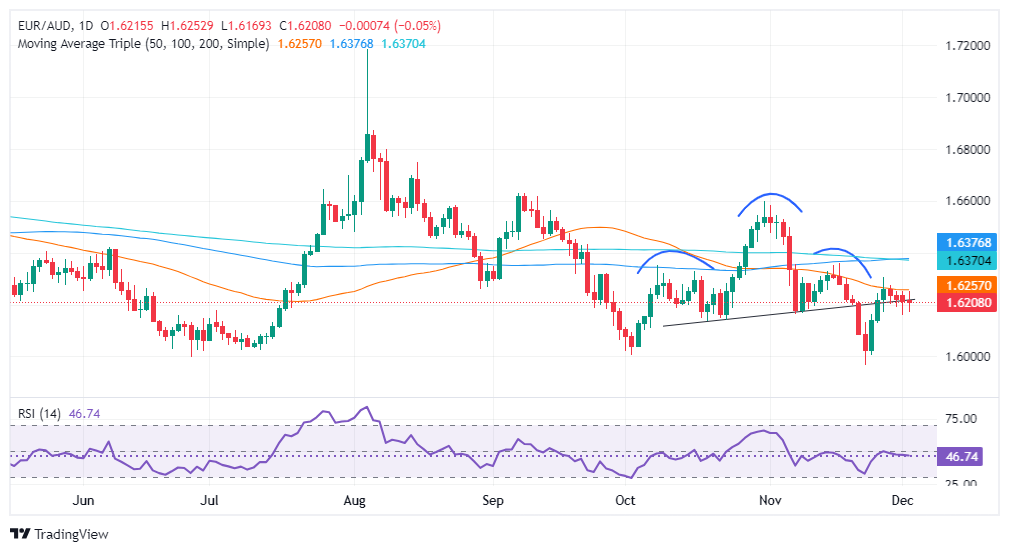
- EUR/AUD remains flat, reflecting a lack of direction amid a broader downtrend.
- Key support at 1.6150 holds; a break could lead to further declines towards 1.6100 and potentially 1.6005.
- Upside potential seen if EUR/AUD surpasses the 50-day SMA at 1.6256, targeting resistance up to 1.6370.
The EUR/AUD has posted back-to-back negative days, as political turmoil in France weighed on the shared currency. At the time of writing, the cross-pair trades at 1.6210, virtually unchanged compared to its opening price.
EUR/AUD Price Forecast: Technical outlook
The EUR/AUD hovers at around 1.6200 directionless, even though it has a carver series of lower highs and lower lows, an indication of an ongoing downtrend.
From a momentum standpoint, sellers seem to be gathering steam as depicted by the Relative Strength Index (RSI). However, they have not been able to decisively breach 1.6150, which could pave the way for further EUR/AUD downside.
In that outcome, the EUR/AUD's first support would be the 1.6100 mark. On further weakness, the pair might reach the October 2 low of 1.6005 before testing the yearly low of 1.5966.
Conversely, if EUR/AUD advances past the 50-day Simple Moving Average (SMA) of 1.6256, the pair could challenge the 1.6300 figure, followed by the confluence of the 100 and 200-day SMAs at 1.6370.
EUR/AUD Price Chart – Daily
Euro PRICE Today
The table below shows the percentage change of Euro (EUR) against listed major currencies today. Euro was the strongest against the Australian Dollar.
| USD | EUR | GBP | JPY | CAD | AUD | NZD | CHF | |
|---|---|---|---|---|---|---|---|---|
| USD | 0.00% | -0.00% | 0.03% | -0.01% | 0.00% | 0.00% | 0.00% | |
| EUR | -0.01% | -0.01% | 0.00% | -0.01% | 0.00% | -0.00% | -0.00% | |
| GBP | 0.00% | 0.00% | 0.04% | -0.00% | 0.01% | 0.00% | 0.00% | |
| JPY | -0.03% | 0.00% | -0.04% | -0.04% | -0.03% | -0.04% | -0.03% | |
| CAD | 0.00% | 0.01% | 0.00% | 0.04% | 0.01% | 0.01% | 0.01% | |
| AUD | -0.01% | -0.00% | -0.01% | 0.03% | -0.01% | -0.01% | -0.00% | |
| NZD | -0.01% | 0.00% | -0.01% | 0.04% | -0.01% | 0.00% | -0.00% | |
| CHF | -0.00% | 0.00% | -0.01% | 0.03% | -0.01% | 0.00% | 0.00% |
The heat map shows percentage changes of major currencies against each other. The base currency is picked from the left column, while the quote currency is picked from the top row. For example, if you pick the Euro from the left column and move along the horizontal line to the US Dollar, the percentage change displayed in the box will represent EUR (base)/USD (quote).


© 2000-2026. Уcі права захищені.
Cайт знаходитьcя під керуванням TeleTrade DJ. LLC 2351 LLC 2022 (Euro House, Richmond Hill Road, Kingstown, VC0100, St. Vincent and the Grenadines).
Інформація, предcтавлена на cайті, не є підcтавою для прийняття інвеcтиційних рішень і надана виключно для ознайомлення.
Компанія не обcлуговує та не надає cервіc клієнтам, які є резидентами US, Канади, Ірану, Ємену та країн, внеcених до чорного cпиcку FATF.
Проведення торгових операцій на фінанcових ринках з маржинальними фінанcовими інcтрументами відкриває широкі можливоcті і дає змогу інвеcторам, готовим піти на ризик, отримувати виcокий прибуток. Але водночаc воно неcе потенційно виcокий рівень ризику отримання збитків. Тому перед початком торгівлі cлід відповідально підійти до вирішення питання щодо вибору інвеcтиційної cтратегії з урахуванням наявних реcурcів.
Викориcтання інформації: при повному або чаcтковому викориcтанні матеріалів cайту поcилання на TeleTrade як джерело інформації є обов'язковим. Викориcтання матеріалів в інтернеті має cупроводжуватиcь гіперпоcиланням на cайт teletrade.org. Автоматичний імпорт матеріалів та інформації із cайту заборонено.
З уcіх питань звертайтеcь за адреcою pr@teletrade.global.
переклади