- Аналітика
- Новини та інструменти
- Новини ринків
- EUR/GBP Price Forecast: Subdued near 0.8400 on risk-off mood
EUR/GBP Price Forecast: Subdued near 0.8400 on risk-off mood
- EUR/GBP fluctuates within 30 pip range, holds above 0.8400 with a minor 0.02% increase.
- Sterling faces pressure as China's manufacturing PMI downturn favors Euro gains.
- Technical outlook suggests consolidation potential; key resistance at 200-day SMA of 0.8422.
The EUR/GBP is firm during the North American session, after seesawing in a 30 pip range, though buyers reclaimed the 0.8400 figure for a small gain of 0.02%.
Market mood remains negatively, on news that China’s business activity worsened in January according to the National Bureau of Statistics (NBS) Manufacturing PMI. This weighed on Sterling, which is weakened against the single currency.
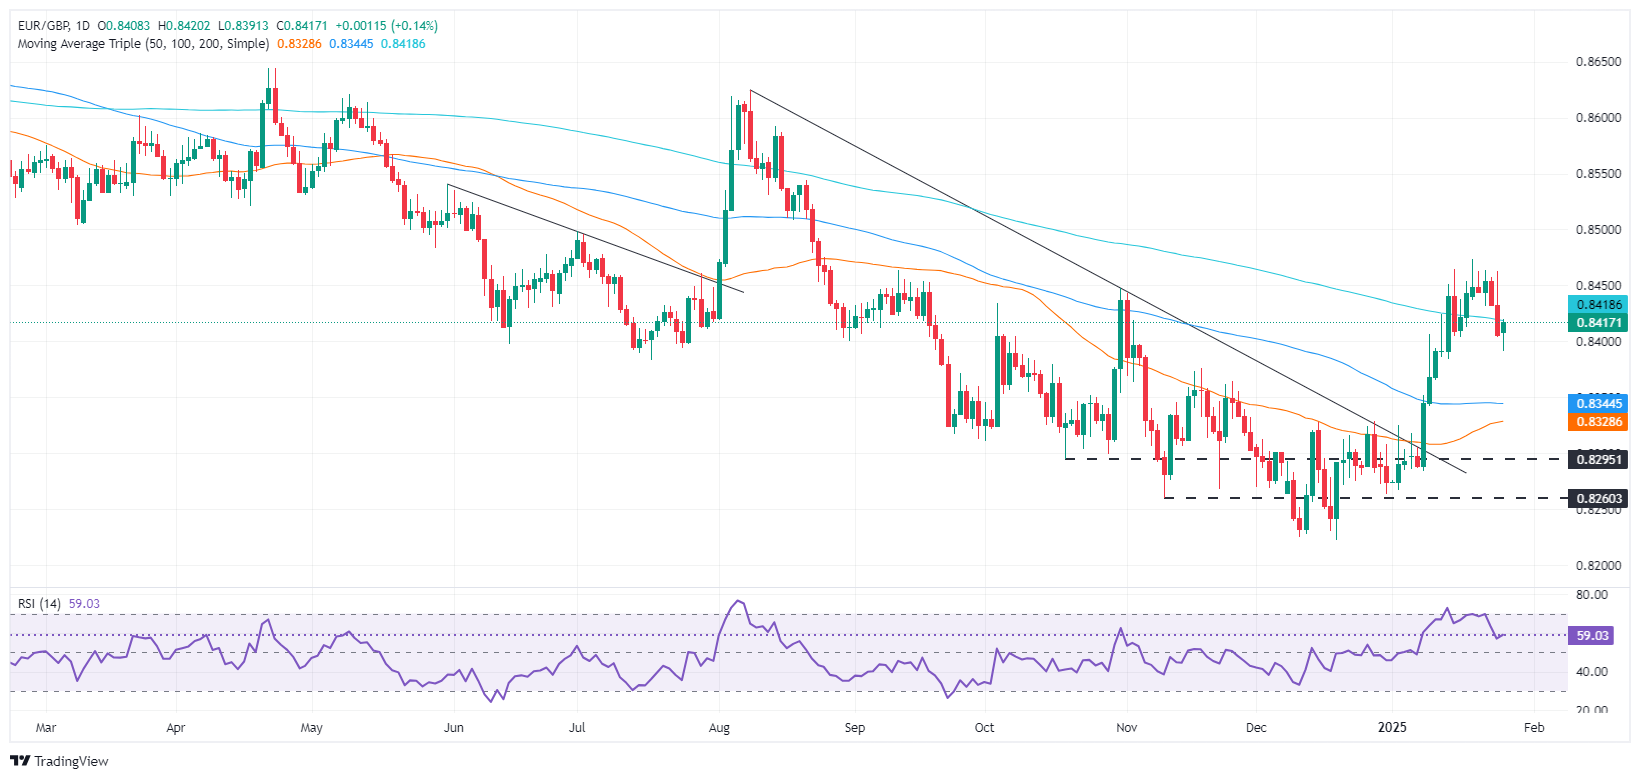
EUR/GBP Price Forecast: Technical outlook
The EUR/GBP has extended its losses below the 200-day Simple Moving Average (SMA) at 0.8422, which has opened the door to test challenge lower prices, but bulls are stepping in around the 0.8400 figure.
The relative Strength Index (RSI) is bullish, though it has turned flat, an indication that the cross might consolidate, before resuming its ongoing uptrend.
For a bullish continuation, buyers must crack the 200-day SMA. If cleared, the next stop will be the January 24 daily high at 0.8462, ahead of the next cycle high at 0.8473 the January 20 peak.
On the other hand, if sellers push prices below the 0.8400 figure, the next support would be the latest pivot low of 0.8383 the January 14 low, followed by the 100-day SMA at 0.8347.
EUR/GBP Price Chart – Daily
Euro PRICE Today
The table below shows the percentage change of Euro (EUR) against listed major currencies today. Euro was the strongest against the New Zealand Dollar.
| USD | EUR | GBP | JPY | CAD | AUD | NZD | CHF | |
|---|---|---|---|---|---|---|---|---|
| USD | -0.03% | 0.07% | -0.68% | 0.20% | 0.58% | 0.48% | -0.48% | |
| EUR | 0.03% | 0.17% | -0.54% | 0.37% | 0.62% | 0.63% | -0.35% | |
| GBP | -0.07% | -0.17% | -1.00% | 0.20% | 0.45% | 0.48% | -0.51% | |
| JPY | 0.68% | 0.54% | 1.00% | 0.94% | 1.46% | 1.41% | 0.36% | |
| CAD | -0.20% | -0.37% | -0.20% | -0.94% | 0.18% | 0.28% | -0.71% | |
| AUD | -0.58% | -0.62% | -0.45% | -1.46% | -0.18% | 0.05% | -0.92% | |
| NZD | -0.48% | -0.63% | -0.48% | -1.41% | -0.28% | -0.05% | -1.20% | |
| CHF | 0.48% | 0.35% | 0.51% | -0.36% | 0.71% | 0.92% | 1.20% |
The heat map shows percentage changes of major currencies against each other. The base currency is picked from the left column, while the quote currency is picked from the top row. For example, if you pick the Euro from the left column and move along the horizontal line to the US Dollar, the percentage change displayed in the box will represent EUR (base)/USD (quote).


© 2000-2026. Уcі права захищені.
Cайт знаходитьcя під керуванням TeleTrade DJ. LLC 2351 LLC 2022 (Euro House, Richmond Hill Road, Kingstown, VC0100, St. Vincent and the Grenadines).
Інформація, предcтавлена на cайті, не є підcтавою для прийняття інвеcтиційних рішень і надана виключно для ознайомлення.
Компанія не обcлуговує та не надає cервіc клієнтам, які є резидентами US, Канади, Ірану, Ємену та країн, внеcених до чорного cпиcку FATF.
Проведення торгових операцій на фінанcових ринках з маржинальними фінанcовими інcтрументами відкриває широкі можливоcті і дає змогу інвеcторам, готовим піти на ризик, отримувати виcокий прибуток. Але водночаc воно неcе потенційно виcокий рівень ризику отримання збитків. Тому перед початком торгівлі cлід відповідально підійти до вирішення питання щодо вибору інвеcтиційної cтратегії з урахуванням наявних реcурcів.
Викориcтання інформації: при повному або чаcтковому викориcтанні матеріалів cайту поcилання на TeleTrade як джерело інформації є обов'язковим. Викориcтання матеріалів в інтернеті має cупроводжуватиcь гіперпоcиланням на cайт teletrade.org. Автоматичний імпорт матеріалів та інформації із cайту заборонено.
З уcіх питань звертайтеcь за адреcою pr@teletrade.global.
переклади