- Аналітика
- Новини та інструменти
- Новини ринків
- EUR/USD Price Analysis: Falls toward 1.0200 near 27-month lows
EUR/USD Price Analysis: Falls toward 1.0200 near 27-month lows
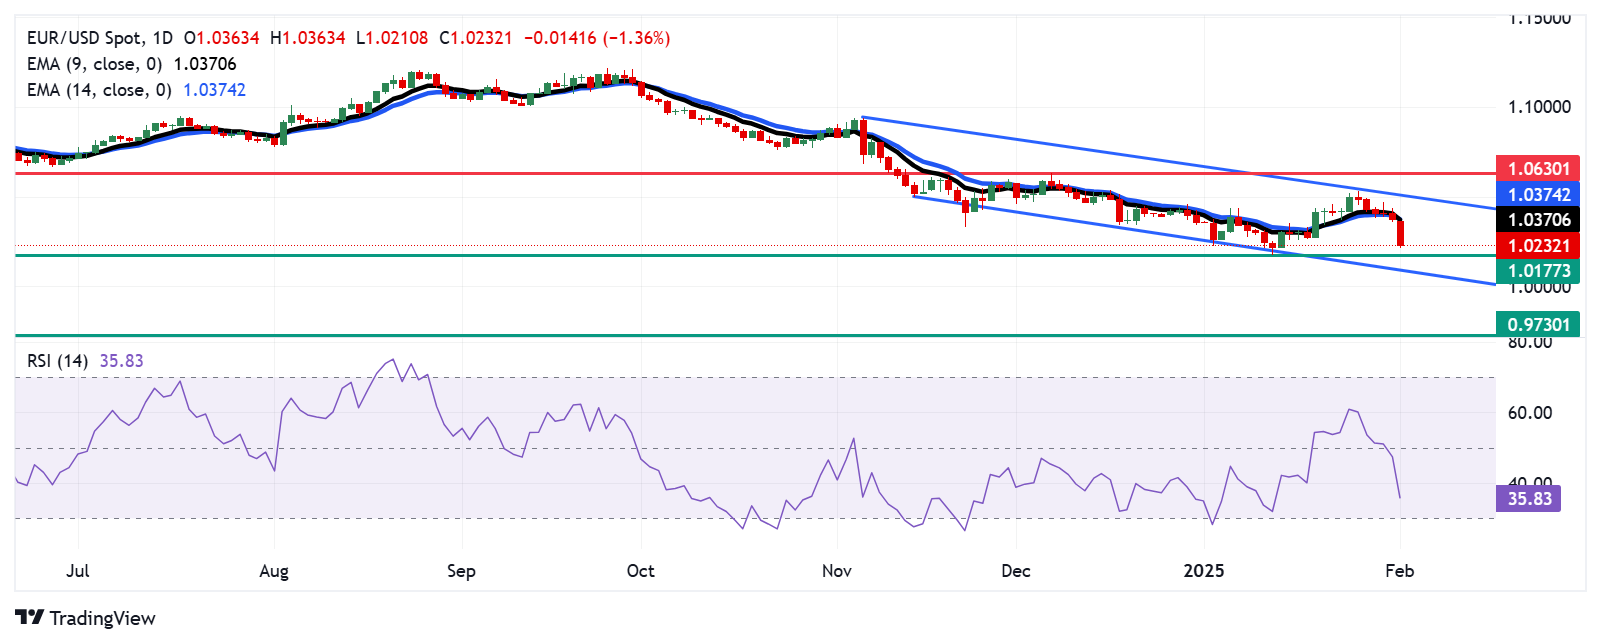
- EUR/USD struggles as it is confined within a descending channel pattern.
- The 14-day RSI drops near the 30 level, indicating persistent selling pressure on the pair.
- The primary support appears at 1.0177, a 27-month low reached on January 14.
The EUR/USD pair continues its downward trend, which started on January 27, trading around 1.0230 during the Asian session on Monday. A closer examination of the daily chart indicates that the bearish momentum is likely to persist, with the pair confined within a descending channel pattern.
The 14-day Relative Strength Index (RSI), a key indicator of momentum, is falling towards the 30 level, suggesting ongoing selling pressure on the EUR/USD pair. Furthermore, the pair remains below both the nine- and 14-day Exponential Moving Averages (EMAs), signaling weaker short-term momentum and reinforcing the bearish outlook.
The EUR/USD pair is likely to test its primary support at 1.0177, a 27-month low reached on January 14. A break below this level could push the pair towards the psychological support at 1.0000, aligning with the lower boundary of the descending channel. A decisive move below this point could intensify the bearish sentiment, potentially driving the pair down to 0.9730, the lowest level since November 2022.
On the upside, the EUR/USD pair could face initial resistance at the nine-day EMA around 1.0369. A breakout above this level could improve market sentiment, paving the way for a move toward the upper boundary of the descending channel at 1.0500. Further gains may bring the pair to the three-month high of 1.0630, reached on December 6.
EUR/USD: Daily Chart
Euro PRICE Today
The table below shows the percentage change of Euro (EUR) against listed major currencies today. Euro was the weakest against the US Dollar.
| USD | EUR | GBP | JPY | CAD | AUD | NZD | CHF | |
|---|---|---|---|---|---|---|---|---|
| USD | 1.25% | 1.06% | 0.40% | 0.31% | 1.49% | 0.92% | 0.05% | |
| EUR | -1.25% | 0.21% | 0.46% | 0.37% | 0.70% | 0.97% | 0.10% | |
| GBP | -1.06% | -0.21% | -0.84% | 0.16% | 0.50% | 0.76% | -0.10% | |
| JPY | -0.40% | -0.46% | 0.84% | -0.09% | 1.24% | 1.42% | 0.29% | |
| CAD | -0.31% | -0.37% | -0.16% | 0.09% | 0.07% | 0.60% | -0.26% | |
| AUD | -1.49% | -0.70% | -0.50% | -1.24% | -0.07% | 0.27% | -0.59% | |
| NZD | -0.92% | -0.97% | -0.76% | -1.42% | -0.60% | -0.27% | -0.86% | |
| CHF | -0.05% | -0.10% | 0.10% | -0.29% | 0.26% | 0.59% | 0.86% |
The heat map shows percentage changes of major currencies against each other. The base currency is picked from the left column, while the quote currency is picked from the top row. For example, if you pick the Euro from the left column and move along the horizontal line to the US Dollar, the percentage change displayed in the box will represent EUR (base)/USD (quote).


© 2000-2026. Уcі права захищені.
Cайт знаходитьcя під керуванням TeleTrade DJ. LLC 2351 LLC 2022 (Euro House, Richmond Hill Road, Kingstown, VC0100, St. Vincent and the Grenadines).
Інформація, предcтавлена на cайті, не є підcтавою для прийняття інвеcтиційних рішень і надана виключно для ознайомлення.
Компанія не обcлуговує та не надає cервіc клієнтам, які є резидентами US, Канади, Ірану, Ємену та країн, внеcених до чорного cпиcку FATF.
Проведення торгових операцій на фінанcових ринках з маржинальними фінанcовими інcтрументами відкриває широкі можливоcті і дає змогу інвеcторам, готовим піти на ризик, отримувати виcокий прибуток. Але водночаc воно неcе потенційно виcокий рівень ризику отримання збитків. Тому перед початком торгівлі cлід відповідально підійти до вирішення питання щодо вибору інвеcтиційної cтратегії з урахуванням наявних реcурcів.
Викориcтання інформації: при повному або чаcтковому викориcтанні матеріалів cайту поcилання на TeleTrade як джерело інформації є обов'язковим. Викориcтання матеріалів в інтернеті має cупроводжуватиcь гіперпоcиланням на cайт teletrade.org. Автоматичний імпорт матеріалів та інформації із cайту заборонено.
З уcіх питань звертайтеcь за адреcою pr@teletrade.global.
переклади