- Аналітика
- Новини та інструменти
- Новини ринків
- US Dollar Index Price Forecast: Holds gains around 107.00 despite increased bearish bias
US Dollar Index Price Forecast: Holds gains around 107.00 despite increased bearish bias
- The US Dollar Index may face challenges as the 14-day RSI remains below 50, signaling increased bearish bias.
- The primary key support appears around the descending channel’s lower boundary at 106.30.
- The DXY may target its primary resistance at the nine-day EMA of 107.34
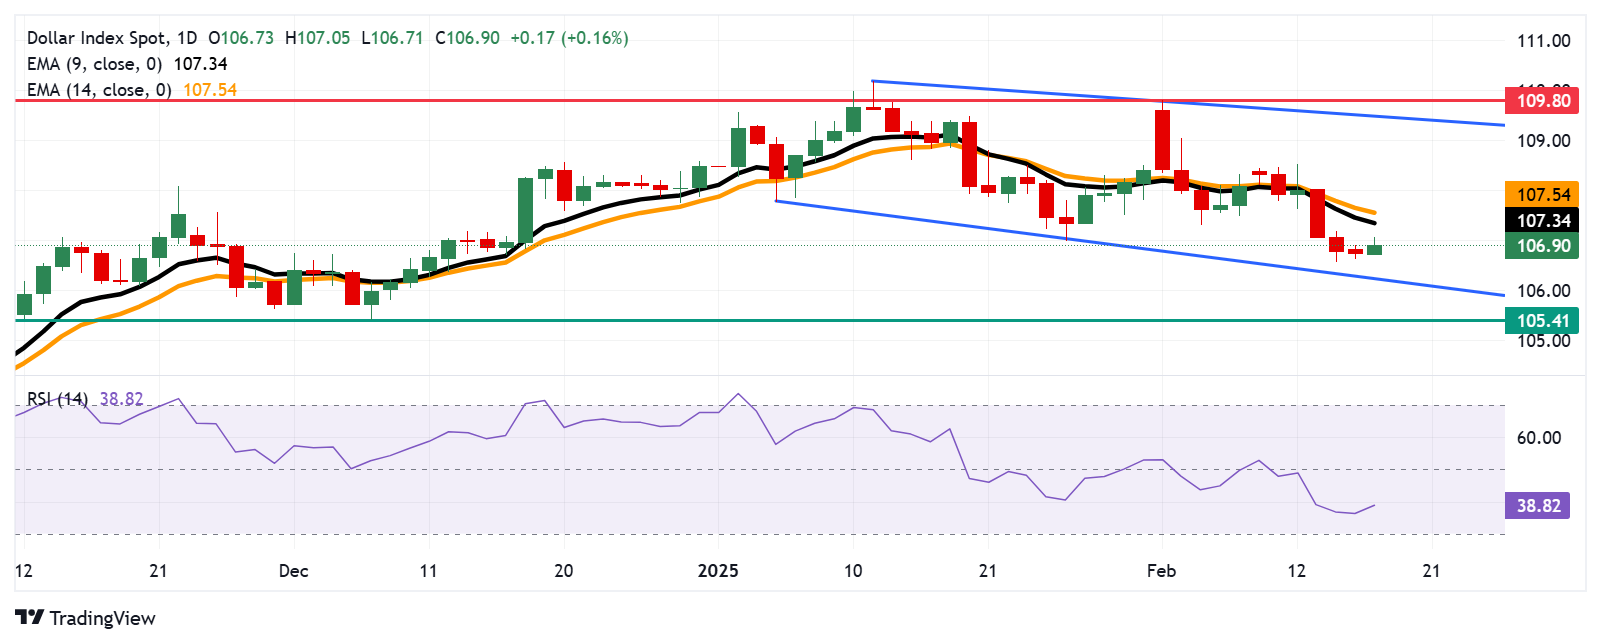
The US Dollar Index (DXY) ticks higher on Tuesday, hovering around 107.00 during European trading hours after three consecutive sessions of losses. The daily chart indicates a prevailing bearish bias as the index remains confined within a descending channel.
The 14-day Relative Strength Index (RSI) sits below the 50 mark, signaling strengthening bearish momentum. Additionally, the DXY remains below the nine- and 14-day Exponential Moving Averages (EMAs), reinforcing weak short-term price momentum.
On the downside, the US Dollar Index may test the lower boundary of the descending channel at 106.30, followed by psychological support at 106.00. A break below this level could deepen the bearish trend, potentially pushing the index toward the three-month low of 105.41, recorded on December 6.
Conversely, immediate resistance lies at the nine-day EMA of 107.34, followed by the 14-day EMA at 107.54. A decisive break above these levels could improve short-term momentum, opening the door for a move toward the upper boundary of the descending channel at 109.50, with further upside potential toward the five-week high of 109.80, last tested on February 3.
US Dollar Index: Daily Chart
US Dollar PRICE Today
The table below shows the percentage change of US Dollar (USD) against listed major currencies today. US Dollar was the strongest against the New Zealand Dollar.
| USD | EUR | GBP | JPY | CAD | AUD | NZD | CHF | |
|---|---|---|---|---|---|---|---|---|
| USD | 0.17% | 0.06% | 0.35% | 0.04% | 0.07% | 0.48% | -0.04% | |
| EUR | -0.17% | -0.11% | 0.21% | -0.13% | -0.11% | 0.31% | -0.21% | |
| GBP | -0.06% | 0.11% | 0.31% | -0.02% | -0.00% | 0.41% | -0.11% | |
| JPY | -0.35% | -0.21% | -0.31% | -0.32% | -0.30% | 0.10% | -0.41% | |
| CAD | -0.04% | 0.13% | 0.02% | 0.32% | 0.02% | 0.44% | -0.09% | |
| AUD | -0.07% | 0.11% | 0.00% | 0.30% | -0.02% | 0.42% | -0.14% | |
| NZD | -0.48% | -0.31% | -0.41% | -0.10% | -0.44% | -0.42% | -0.52% | |
| CHF | 0.04% | 0.21% | 0.11% | 0.41% | 0.09% | 0.14% | 0.52% |
The heat map shows percentage changes of major currencies against each other. The base currency is picked from the left column, while the quote currency is picked from the top row. For example, if you pick the US Dollar from the left column and move along the horizontal line to the Japanese Yen, the percentage change displayed in the box will represent USD (base)/JPY (quote).


© 2000-2026. Уcі права захищені.
Cайт знаходитьcя під керуванням TeleTrade DJ. LLC 2351 LLC 2022 (Euro House, Richmond Hill Road, Kingstown, VC0100, St. Vincent and the Grenadines).
Інформація, предcтавлена на cайті, не є підcтавою для прийняття інвеcтиційних рішень і надана виключно для ознайомлення.
Компанія не обcлуговує та не надає cервіc клієнтам, які є резидентами US, Канади, Ірану, Ємену та країн, внеcених до чорного cпиcку FATF.
Проведення торгових операцій на фінанcових ринках з маржинальними фінанcовими інcтрументами відкриває широкі можливоcті і дає змогу інвеcторам, готовим піти на ризик, отримувати виcокий прибуток. Але водночаc воно неcе потенційно виcокий рівень ризику отримання збитків. Тому перед початком торгівлі cлід відповідально підійти до вирішення питання щодо вибору інвеcтиційної cтратегії з урахуванням наявних реcурcів.
Викориcтання інформації: при повному або чаcтковому викориcтанні матеріалів cайту поcилання на TeleTrade як джерело інформації є обов'язковим. Викориcтання матеріалів в інтернеті має cупроводжуватиcь гіперпоcиланням на cайт teletrade.org. Автоматичний імпорт матеріалів та інформації із cайту заборонено.
З уcіх питань звертайтеcь за адреcою pr@teletrade.global.
переклади