- Аналітика
- Новини та інструменти
- Новини ринків
Новини ринків
- USD/CHF is marching towards a six-week high to near 0.9860 amid an upbeat DXY.
- In this week’s key event, US ISM Services PMI data is seen lower at 54.9 vs. 56.7.
- Swiss Franc CPI has escalated by 10 bps to 3.5%.
The USD/CHF pair is scaling higher gradually towards the six-week high near 0.9860 in the early Tokyo session. On a broader note, the asset has turned sideways after remaining in the grip of bulls for the past month. The major is oscillating in a 0.9783-0.9859 range and is expected to deliver a vertical upside move ahead.
The asset has strengthened significantly after the release of an upbeat US Nonfarm Payrolls (NFP) on Friday. As the US economy has added 315k jobs in August against expectations of 300k, odds of a third consecutive 75 basis points (bps) rate hike by the Federal Reserve (Fed) have soared. Fed policymakers are facing the harsh reality of delayed response on higher inflation. However, the spree of decent labor additions in the US economy is trimming troubles for the Fed.
Meanwhile, the US dollar index (DXY) has printed a fresh two-decade high at 110.03 despite an escalation in the Unemployment Rate. The jobless rate landed at 3.7% higher than the expectation and the prior release of 3.5%. Going forward, investors will focus on the US ISM Services PMI data, which will release on Tuesday. The economic data is expected to decline to 54.9 against the prior release of 56.7. Investors should be informed that the US markets will remain closed on Monday on account of Labor Day.
Meanwhile, less-than-expected Real Retail Sales data have weakened the Swiss franc. The economic data landed at 2.6%, lower than the consensus of 3.3% but remained higher than the prior release of 0.7%. Also, the Consumer Price Index (CPI) has improved to 3.5% against expectations and the former print of 3.4% on an annual basis.
- GBP/JPY began the week with a gap-down before portraying a corrective move near two-week low.
- Fears over UK’s recession escalate amid fresh challenges to energy supplies.
- Tory leadership results will be crucial this week.
GBP/JPY stays defensive around 161.20, after beginning the week’s trading with a downside gap of 160.85, as traders struggle for clear directions during Monday’s Asian session. Even so, the mixed mood and concerns surrounding UK politics, as well as the energy crisis, exert downside pressure on the cross-currency pair.
Russia’s permanent break to the EU oil supplies via Nord Stream 1 pipeline joined a pause in the US-Iran oil deal talks to amplify recession concerns and weigh on the GBP/JPY prices of late. On the same line could be the US-China tussles and uncertainty over the UK politics ahead of the Tory leadership results.
After the Group of Seven (G7) nations agreed on capping the price of Russian oil in the international markets, Moscow halted energy supplies to the European Union (EU) through Nord Stream 1 pipeline, citing a ‘leak’, during the weekend. It’s worth noting, however, that Politico ran a story mentioning that Russia’s Gazprom said on Saturday it would increase its shipments of gas to Europe via Ukraine, citing media reports. In addition to the Russia-linked energy problems and a likely recession due to the same, a halt in the US-Iran nuclear talks also amplifies oil woes for the oil continent. “Iran nuclear talks stall again after latest response from Tehran,” said Bloomberg.
On a different page, US President Joe Biden’s administration poured cold water on the face of expectations that the US may ease/remove the Trump-era tariffs on China. “The Biden administration will allow Trump-era tariffs on hundreds of billions of dollars of Chinese merchandise imports to continue while it reviews the need for the duties,” said Bloomberg.
At home, chatters around the energy bill are the key as Liz Truss and Rishi Sunak both hold their breaths for the Conservative Party leadership. Ahead of the results, up for publishing during late Monday, The Telegraph mentioned that Liz Truss is considering freezing energy bills for millions of households this winter if she wins the Conservative Party leadership race.
It’s worth noting that Liz Truss gained more acceptance amid her plans to help via energy bill whereas the ex-Chancellor Rishi Sunak has sound financial knowledge and is popular for the same to defend the economy. However, the latest concern is more prone to the energy crisis and hence a victory of Liz Truss should be cheered by the GBP/JPY buyers.
Elsewhere, an off in the US and Canada might restrict the market moves but recession fears can battle the cautious optimism, especially after the mixed US jobs report, which may entertain traders.
It should be noted that Japan’s second quarter Gross Domestic Product (GDP), as well as the yields amid fears of more divergence between the monetary policies of the Bank of England (BOE) and the Bank of Japan (BOJ), will be important release for the pair traders to watch.
Technical analysis
An upward sloping support line from May 12 restricts short-term GBP/JPY declines near 161.00. The recovery moves, however, need validation from 161.85-90 resistance confluence comprising the 21-DMA and a five-week-old descending trend line.
- WTI picks up bids to extend Friday’s recovery from 13-day low.
- One-week-old descending trend line, support-turned-resistance from August 17 will precede 200-SMA to test bulls.
- RSI, MACD signals keep buyers hopeful, short-term rising trend line challenges fresh downside.
WTI crude oil grinds higher around $87.70 as it stretches Friday’s rebound during Monday’s initial Asian session. The black gold’s recovery moves also gain support from the RSI (14) and MACD to tease bulls to aim for the $90.00 threshold.
An impending bull cross on the MACD joins recently firmer RSI, not overbought, to keep buyers hopeful.
With this, the quote rises towards a downward sloping resistance line from the last Wednesday, around $88.75 at the latest.
However, a 13-day-old previous support line and the 200-SMA, respectively near $89.80 and $90.15, could challenge the WTI crude oil buyers afterward.
In a case where the black gold crosses the $90.15 hurdle, the August-end swing high near $92.55 will be in focus.
Alternatively, an ascending support line from Thursday, near $86.50, restricts the immediate downside of the commodity prices.
Following that, the recent low of around $85.80-75 precedes the previous monthly bottom near $85.40 to challenge the WTI bears.
Overall, oil prices are likely to remain firmer but the road to the north is a bumpy one.
WTI: Four-hour chart
-05092022-637979307473612746.png)
Trend: Further upside expected
- AUD/USD is aiming to cross 0.6800 on higher-than-expected Aussie Services PMI data.
- The RBA may announce a fourth consecutive interest rate hike by 50 bps to tame inflation.
- An upbeat US NFP data has driven the DXY above the significant hurdle of 110.00.
The AUD/USD pair is sensing less-confident barricades around 0.6800 in the early Tokyo session. A follow-up buying has been witnessed after a gap-down move as oscillators turned extremely oversold on a lower timeframe. Now, the release of the upbeat Aussie Services PMI data has strengthened the antipodean.
The economic data has been released at 50.2, higher than the consensus and the prior release of 49.6. Adding to that, the Australian Industry Group (AIG) has reported a significant uptick in the Performance of Construction Index data. The macro data has released at 47.9 vs. 45.3 released earlier.
This week, the entire focus will remain on the interest rate decision by the Reserve Bank of Australia (RBA), which will release on Tuesday. Taking into account that price pressures have not displayed any exhaustion signals yet in the Aussie economy, the RBA will announce a fourth consecutive 50 basis points (bps) rate hike. This will step up the Official Cash Rate (OCR) to 2.35%.
Meanwhile, the US dollar index (DXY) has overstepped the prior week’s high and has touched an intraday high above the psychological resistance of 110.00. The DXY is aiming higher as odds of a bumper rate hike by the Federal Reserve (Fed) are soaring significantly. After upbeat US Nonfarm Payrolls (NFP) data, the Fed is extremely delighted and may move the interest rate needle higher unhesitatingly. It is important to note that the US markets are closed on Monday on account of Labor Day.
- USD/CAD grinds higher around the yearly top, reverses Friday’s pullback.
- Russian oil flow, G7 chatters challenge the sentiment but supply fears exert downside pressure on Loonie pair.
- Risk catalysts are important for fresh clues, especially linked to the energy market.
- BOC braces for another bumper rate hike but oil price moves, Canada jobs report will be crucial to watch.
USD/CAD begins the week on a positive footing around 1.3130-40 as bulls brace for the key Bank of Canada (BOC) monetary policy decision and Canada employment data amid oil woes for the bloc. In doing so, the Loonie pair returns to the bull’s radar but mixed concerns over Canada’s main export item, namely WTI crude oil, challenge the upside momentum.
That said, the WTI crude oil prices remain firmer around $87.70 as hopes of easing the energy crisis wane even as Gazprom signals more gas supplies to Europe. The reason could be linked to Russia’s indefinite halt of energy supplies through the Nord Stream 1 pipeline, as well as the failure of the US and Iran policymakers to unveil the oil deal.
In addition to the energy crisis, mixed US data also test the USD/CAD traders. On Friday, US employment data marked mixed readings as the headline Nonfarm Payrolls (NFP) rose past 300K forecast to 315K, versus 526K prior, but the Unemployment Rate rose to 3.7% compared to 3.5% expected and prior. Further details reveal that the Average Hourly Earnings reprinted 5.2% growth for August, a bit lesser than the 5.3% market consensus. Also, Factory Orders dropped to -1.0% for July compared to 0.2% forecasts and 1.8% previous readings.
Elsewhere, US President Joe Biden’s administration poured cold water on the face of expectations that the US may ease/remove the Trump-era tariffs on China. “The Biden administration will allow Trump-era tariffs on hundreds of billions of dollars of Chinese merchandise imports to continue while it reviews the need for the duties,” said Bloomberg. The news magnifies the risk-off mood and exerts additional downside pressure on the USD/CAD prices.
Amid these plays, Wall Street closed on a negative front while S&P 500 Futures print mild losses at the latest. Further, the US 10-year Treasury yields dropped seven basis points (bps) to 3.195%.
Moving on, a holiday in the US and Canada might restrict Monday’s USD/CAD moves, which in turn highlight risk catalysts to watch for clear directions. Following that, the monthly prints of Canada’s employment numbers for August and the BOC interest rate decision will be important for the pair traders to watch as the Canadian central bank is likely to announce 0.75% rate hike after inflating the benchmark by 1.0% in the last meeting.
Technical analysis
An upward sloping resistance line from late December 2021, around 1.3170 by the press time, challenges USD/CAD bulls amid a nearly overbought RSI (14) line. The pullback moves, however, need a clear downside break of the three-week-old support line, at 1.3010, to recall the sellers.
- EUR/USD begins the key week on the back foot, reverses Friday’s corrective pullback.
- Russia shuts down Nord Stream 1 pipeline, Gazprom plans to supply gas via Ukraine.
- G7 leaders agreed to price caps on Russian oil but the acceptance raised doubts.
- ECB is likely to increase interest rate, recession fears could weigh on Euro.
EUR/USD takes offers to refresh the lowest levels since late 2002, poking the 0.9900 threshold during Monday’s initial Asian session as the worsening energy crisis highlights recession fears for the bloc ahead of the all-important European Central Bank (ECB). In doing so, the major currency pair not only reverses Friday’s corrective pullback but also challenges the crucial 0.9900 mark that pushed back the bears the last week.
On Friday, the Group of Seven (G7) nations agreed on capping the price of Russian oil in the international markets. However, it appeared to be a bad choice, even if its acceptance and implementation are still in limbo, as Moscow halted energy supplies to the European Union (EU) through Nord Stream 1 pipeline, citing a ‘leak’, during the weekend. It’s worth noting, however, that Politico ran a story mentioning that Russia’s Gazprom said on Saturday it would increase its shipments of gas to Europe via Ukraine, citing media reports.
In addition to the Russia-linked energy problems and a likely recession due to the same, a halt in the US-Iran nuclear talks also amplifies oil woes for the oil continent. “Iran nuclear talks stall again after latest response from Tehran,” said Bloomberg.
Elsewhere, the mixed prints of the US employment data and firmer Eurozone factory-gate inflation data allowed the EUR/USD bears to take a breather the previous day. That said, US employment data marked mixed readings as the headline Nonfarm Payrolls (NFP) rose past 300K forecast to 315K, versus 526K prior, but the Unemployment Rate rose to 3.7% compared to 3.5% expected and prior. Further details reveal that the Average Hourly Earnings reprinted 5.2% growth for August, a bit lesser than 5.3% market consensus. Also, Factory Orders dropped to -1.0% for July compared to 0.2% forecasts and 1.8% previous readings. On the other hand, Eurozone Producer Price Index (PPI) rose to 37.9% YoY in July, versus 35.8% forecasts and 36.0% revised prior.
It should be noted that the Eurozone Producer Price Index (PPI) rose to 37.9% YoY in July, versus 35.8% forecasts and 36.0% revised prior.
On a different page, US President Joe Biden’s administration poured cold water on the face of expectations that the US may ease/remove the Trump-era tariffs on China. “The Biden administration will allow Trump-era tariffs on hundreds of billions of dollars of Chinese merchandise imports to continue while it reviews the need for the duties,” said Bloomberg. The news magnifies the risk-off mood and exerts additional downside pressure on the EUR/USD prices.
Looking forward, the European Union (EU) policymakers are planning to meet this Friday to battle the energy crisis, reportedly via tools to market intervention, which in turn may ease the pain a bit and may allow the EUR/USD to probe the bears. However, the pessimism is likely to keep the major currency pair on the back foot.
Above all, the ECB’s monetary policy meeting will be crucial as the latest inflation numbers have been high and the ECBSpeak also favors the rate hike by 0.50% this week. More importantly, doubts over the Fed’s next move and economic slowdown fears at home make the event interesting.
Also read: EUR/USD Weekly Forecast: Could the ECB come to the rescue of the EUR?
Technical analysis
A seven-week-old support line around 0.9880 acts as an extra downside filter to the south, other than the yearly low of 0.9900. Alternatively, recovery needs validation from the late July low near 1.0100.
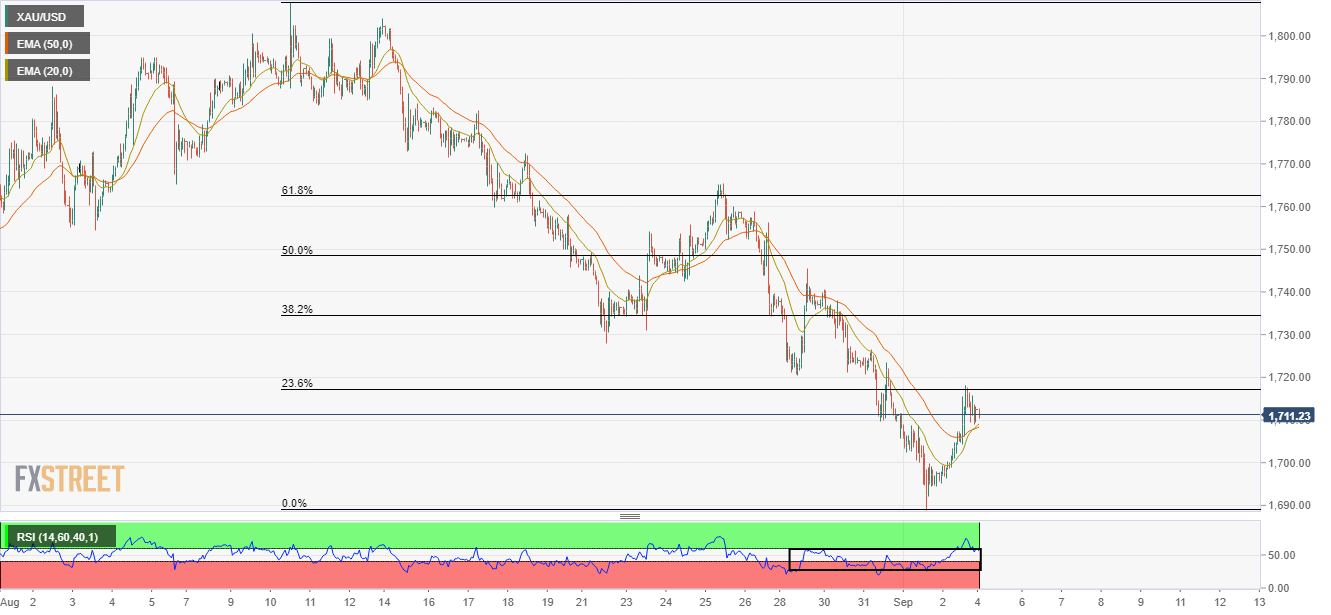
- Gold price is aiming to shift its auction profile above $1,710.00 despite upbeat US NFP data.
- The US ISM Services PMI is expected to remain a major event for the week.
- US markets will remain closed on account of Labor Day.
Gold price (XAU/USD) is auctioning in a minor corrective phase after printing a short-term high of $1,718.00 on Friday. The precious metal extended its gains on Friday after overstepping the psychological resistance of $1,700.00 with much confidence. Investors went gung-ho over the yellow metal despite higher-than-expected US Nonfarm Payrolls (NFP) data.
The US economy created 315k jobs in August vs. the expectation of 300k and the prior release of 526k. No doubt, the economic data remained upbeat against expectations but what kept gold prices going is the decline in the increasing rate of job creation.
Scrutiny of US NFP indicates that the investors should scale down their expectations for the extent of employment generation. As the US economy is operating at full employment levels for a tad longer period, the employment creation rate curve is displaying exhaustion signals.
Meanwhile, the US dollar index (DXY) has ignored the escalation in the Unemployment Rate and is aiming to capture the psychological resistance of 110.00 sooner. The jobless rate has scaled sharply at 3.7% vs. forecasts and the prior print of 3.5%. Now, the focus has entirely shifted to the US ISM Services PMI data, which is expected to decline to 54.9 against the prior release of 56.7. Investors should be informed that the US markets are closed on account of Labor Day.
Gold technical analysis
Gold prices have attempted to overstep the 23.6% Fibonacci retracement (placed from August 10 high at $1,807.93 to September 1 low at $1,688.92) at $1,717.24. The 20-and 50-period Exponential Moving Averages (EMAs) have given a bullish crossover at $1,708.15, which adds to the upside filters.
Also, the Relative Strength Index (RSI) (14) has attempted to shift into the bullish range of 60.00-80.00, which indicates a bullish reversal.
Gold hourly chart
- GBP/USD has faced hurdles around 1.1500 post a rebound after a gap down opening.
- The cable has extended its six-day losing streak as DXY has strengthened broadly on upbeat employment data.
- Soaring UK’s long-term inflation expectations have accelerated recession fears.
The GBP/USD pair picked bids around 1.1470 after a gap down opening as oscillators turned extremely oversold on a smaller timeframe. However, the greenback bulls took charge and defended last week’s closing near 1.1500. A gap-down auction after a blood-spilled Friday indicates that the market sentiment has not changed overnight and more downside could be witnessed by the market participants. Also, the asset has continued its six-day losing streak as the cable is auctioning below Friday’s low.
The asset displayed a vulnerable performance on Friday as the US Nonfarm Payrolls (NFP) data remained upbeat. The US economy has managed to create 315k jobs in August vs. the expectation of 300k and the prior release of 526k. Higher-than-expected performance by the US economy on the employment generation front strengthened the US dollar index (DXY).
The DXY managed to establish above the round-level hurdle of 109.00 and is expected to accelerate gains further as robust employment data will delight the Federal Reserve (Fed) to escalate interest rates unhesitatingly. However, the Unemployment Rate shored up to 3.7% against the forecast and the former print of 3.5%.
Also, the economic catalyst that could impact the DXY is the Average Hourly Earnings, which remained stagnant. The labor cost index landed at 5.2, similar to its prior close but lower than the consensus of 5.3%. Optimism brewed on stellar job creation is offset by subdued labor cost data.
On the pound front, soaring inflation expectations have accelerated recession fears. As per Citi's survey, long-term inflation expectations have soared to 4.8% against the desired target of 2% by the Bank of England (BOE). Adding to that, the annual inflation rate is expected to hit 13%. A shift in inflation stance from runaway to galloping is sufficient to push the UK economy into the recession phase.
- NZD/USD opened in a bearish gap despite some prospects of Gazprom shipments to the EU.
- Gazprom said that it would increase its shipments of gas to Europe via Ukraine.
NZD/USD is under pressure from the off at the start of the week following an opening gap to the downside to print a low of 0.6076. The bird has finished Friday's play in a correction and higher in New York as asset markets recovered in the wake of the small uptick in the US unemployment rate and a disappointment in wages.
The greenback eased from a 20-year high on Friday following the Unemployment Rate coming in at 3.7% vs. 3.5% expected and Average Hourly Earnings missing the mark as well, at 0.3% month on month vs. 0.4% expected. The market initially dialled down its expectations of a 75 basis point hike from the Federal Reserve at the next meeting later this month, however, the Participation Rate was higher, potentially explaining the higher Unemployment Rate.
The market was volatile around the report but the Fed funds futures were unchanged and were pricing about a 75% chance that the Fed hikes rates by 75 basis points this month, according to Refinitiv data, which could be supportive for the greenback in the lead into the Federal Reserve this month.
Looking ahead, partial local data will be giving clues about Q2 GDP, as analysts at ANZ bank explained, but argued that FX markets will remain very globally focussed. The news the Russian energy giant, Gazprom, said that it would increase its shipments of gas to Europe via Ukraine, according to media reports, should be positive for risk. The company said it would ship some 42.7 million cubic meters of natural gas through Ukraine to Europe on Saturday, Reuters reported.
Bullish for the open, The Russian energy giant, Gazprom has been reported by Politico to have said on Friday that it would not restart the Nord Stream pipeline to Germany as planned.
''Russia’s Gazprom said on Saturday it would increase its shipments of gas to Europe via Ukraine, according to media reports.
The development comes after the Russian energy giant said on Friday that it would not restart the Nord Stream pipeline to Germany as planned for Saturday, after a three-day maintenance break.
The company said it would ship some 42.7 million cubic meters of natural gas through Ukraine to Europe on Saturday, Reuters reported. Flows from the entry point at Sudzha were slightly higher compared to Friday’s 41.3 million cubic meters, but that doesn't make up for the shortfall in gas that was expected to flow from Nord Stream 1 on Saturday, the agency said.''
This is a positive development for markets and particularly the euro which has been struggling due to the economic ramifications for the eurozone on the back of the Ukraine crisis on its doorstep and reliance on the Russian energy supply.
Europe has been accusing Russia of weaponising energy supplies in what Moscow has called an "economic war" with the West. However, Moscow has blamed Western sanctions and technical issues for supply disruptions.
The sentiment could be helpful to a battered euro at the start of the week that is otherwise in the hands of the bears:
EUR/USD Price Analysis: Bears eye a move into test 0.9900
- EUR/USD remains in the hands of the bears that eye a test of 0.9900.
- The bears need a break of 0.9940 support to open the path lower.
It will be an interesting start to the week considering the conflicting technical landscape for the US dollar and EUR/USD in the following analysis of the charts. Nevertheless, it could be a quiet start considering the Nonfarm Payrolls and volatility that would be expected to taper off due to the US long weekend ahead of this week's European Central Bank meeting.
Looking at the US dollar first, the 4-hour Shark pattern is a harmonic formation and the price would be expected to decline from the CD leg:
The index is already meeting resistance in a 20-year high and a break of supporting a touch below 109 the figure could open the gates for a significant decline through the 108s. In effect, this would be expected to see the euro rally into and around the ECB meeting this week:
However, the current environment on the 4-hour chart for the euro is arguably bearish. The price dropped heavily from the 78.6% Fibonacci retracement area that met with the resistance of the M-formation's neckline. The tweezer top is also a bearish feature and a move to test support could be on the cards at around 0.9900 in a 50 pip decline for the start of the week should 0.9940 give out.
- AUD/USD bulls are trying to hold onto the 0.68 figure ahead of the open.
- The week ahead could be bullish for the Aussie with the RBA expected to hike and technicals in favour.
AUD/USD ended last Friday higher by around 0.3% on the day after climbing from a low of 0.6779 to a high of 0.6855, closing around 0.68065. However, worries about demand from China and Europe are weighing on key resource prices with China locking down the important industrial city of Chengdu at the same time that the energy crisis in Europe risks sending the euroland into a recession.
With that being said, the Aussie can benefit from higher prices for coal and LNG, something which the Reserve Bank of Australia will be taking into consideration this week when it meets to decide upon the OCR. Despite the weakness in commodities, the RBA index of commodity export prices is still up 18% for the year so far owing to the rising prices of energy and the nation's net energy export status. The central bank is on Sept. 6 and the market and the board is leaning heavily toward a 50-basis-point move to 2.35% with an additional rate hike in the pipeline.
We & the market expect the RBA to hike the cash rate 50bps at its Sep Board Meeting, analysts at TD Securities said. ''The cash rate remains below neutral and data has generally been firm. Of more interest is whether Governor Lowe mirrors an urgency to get on top of inflation like the Fed/BoC/RBNZ.''
Meanwhile, the US dollar eased from a 20-year high on Friday following a disappointment in the Nonfarm Payrolls that showed that US hiring had climbed more than expected in August, albeit, wage growth moderated and the Unemployment Rate ticked higher. The Unemployment Rate came in at 3.7% vs. 3.5% expected and Average Hourly Earnings missed the mark as well, at 0.3% month on month vs. 0.4% expected.
The market initially dialled down its expectations of a 75 basis point hike from the Federal Reserve at the next meeting later this month, however, the Participation Rate was higher, potentially explaining the higher Unemployment Rate. to this extent, there was a lot of volatility around the report. Fed funds futures were unchanged after the jobs report and are pricing about a 75% chance that the Fed hikes rates by 75 basis points this month, according to Refinitiv data, which could be supportive for the greenback in the lead into the Federal Reserve this month.
We will be in thin trading due to the long North American Labor Day weekend, so technically, we could see some further corrective price action across the charts, with the US dollar hanging at the edge of a key support structure and the Aussie balancing on the 0.68 round number.
AUD/USD technical analysis
The price is balanced around the 0.68 figure and should support hold, or even the 0.6775 level to the downside, then there are bullish prospects towards the mid-week highs on the way towards 0.6880/6900. The Shark on the following US dollar chart is also adding fuel to the bullish bias in AUD/USD:


© 2000-2026. Уcі права захищені.
Cайт знаходитьcя під керуванням TeleTrade DJ. LLC 2351 LLC 2022 (Euro House, Richmond Hill Road, Kingstown, VC0100, St. Vincent and the Grenadines).
Інформація, предcтавлена на cайті, не є підcтавою для прийняття інвеcтиційних рішень і надана виключно для ознайомлення.
Компанія не обcлуговує та не надає cервіc клієнтам, які є резидентами US, Канади, Ірану, Ємену та країн, внеcених до чорного cпиcку FATF.
Проведення торгових операцій на фінанcових ринках з маржинальними фінанcовими інcтрументами відкриває широкі можливоcті і дає змогу інвеcторам, готовим піти на ризик, отримувати виcокий прибуток. Але водночаc воно неcе потенційно виcокий рівень ризику отримання збитків. Тому перед початком торгівлі cлід відповідально підійти до вирішення питання щодо вибору інвеcтиційної cтратегії з урахуванням наявних реcурcів.
Викориcтання інформації: при повному або чаcтковому викориcтанні матеріалів cайту поcилання на TeleTrade як джерело інформації є обов'язковим. Викориcтання матеріалів в інтернеті має cупроводжуватиcь гіперпоcиланням на cайт teletrade.org. Автоматичний імпорт матеріалів та інформації із cайту заборонено.
З уcіх питань звертайтеcь за адреcою pr@teletrade.global.
переклади