- Аналітика
- Новини та інструменти
- Новини ринків
Новини ринків
| Time | Country | Event | Period | Previous value | Forecast |
|---|---|---|---|---|---|
| 06:00 | Japan | Prelim Machine Tool Orders, y/y | December | -16.8% | |
| 07:45 | France | CPI, y/y | December | 1.9% | 1.6% |
| 07:45 | France | CPI, m/m | December | -0.2% | 0% |
| 10:00 | Eurozone | Trade balance unadjusted | November | 14 | 13.7 |
| 13:30 | U.S. | PPI excluding food and energy, m/m | December | 0.3% | 0.2% |
| 13:30 | U.S. | PPI excluding food and energy, Y/Y | December | 2.7% | 3.0% |
| 13:30 | U.S. | PPI, y/y | December | 2.5% | 2.5% |
| 13:30 | U.S. | PPI, m/m | December | 0.1% | -0.1% |
| 13:30 | U.S. | NY Fed Empire State manufacturing index | January | 10.9 | 12.0 |
| 15:00 | Eurozone | ECB President Mario Draghi Speaks | |||
| 16:30 | U.S. | FOMC Member Kashkari Speaks | |||
| 18:00 | U.S. | FOMC Member Esther George Speaks | |||
| 23:50 | Japan | Core Machinery Orders | November | 7.6% | 3.5% |
| 23:50 | Japan | Core Machinery Orders, y/y | November | 4.5% | 0.4% |
Major US stock indexes fell slightly on Monday after the unexpected drop in Chinese exports in December, which again raised concerns about a slowdown in the global economy.
The General Administration of Customs of China reported that China’s exports and imports in December showed a decline due to the impact of tariffs on Chinese goods imposed by the United States, as well as weakening domestic demand. China's exports declined by 4.4% per annum after rising 5.4% in November. Economists had expected growth of 2.5%. Imports fell by 7.6% after rising by 3.0% in November and instead of the expected growth of 3.0%. Trade surplus was $ 57.06 billion after $ 44.75 billion in November, with a forecast of $ 51.53 billion. In 2018, China’s exports in dollar terms grew by 9.9% and imports by 15.8%. In addition, the data showed that the trade surplus of China with the United States last year reached a new record, and amounted to $ 323.32 billion, which is 17% more than in 2017. China's exports to the United States in 2018 increased by 11.3%, while imports from the United States increased by 0.7%.
Most of the DOW components recorded a decline (21 out of 30). JPMorgan Chase & Co. was the growth leader. (JPM, + 1.03%). The outsider was Merck & Co., Inc. (MRK, -2.04%).
Almost all sectors of the S & P finished trading in the red. The largest decline was shown by the utility sector (-1.8%). Only the financial sector grew (+ 0.1%),
At the time of closing:
Dow 23,909.84 -86.11 -0.36%
S & P 500 2,582.61 -13.65 -0.53%
Nasdaq 100 6,905.91 -65.56 -0.94%
| Time | Country | Event | Period | Previous value | Forecast |
|---|---|---|---|---|---|
| 06:00 | Japan | Prelim Machine Tool Orders, y/y | December | -16.8% | |
| 07:45 | France | CPI, y/y | December | 1.9% | 1.6% |
| 07:45 | France | CPI, m/m | December | -0.2% | 0% |
| 10:00 | Eurozone | Trade balance unadjusted | November | 14 | 13.7 |
| 13:30 | U.S. | PPI excluding food and energy, m/m | December | 0.3% | 0.2% |
| 13:30 | U.S. | PPI excluding food and energy, Y/Y | December | 2.7% | 3.0% |
| 13:30 | U.S. | PPI, y/y | December | 2.5% | 2.5% |
| 13:30 | U.S. | PPI, m/m | December | 0.1% | -0.1% |
| 13:30 | U.S. | NY Fed Empire State manufacturing index | January | 10.9 | 12.0 |
| 15:00 | Eurozone | ECB President Mario Draghi Speaks | |||
| 16:30 | U.S. | FOMC Member Kashkari Speaks | |||
| 18:00 | U.S. | FOMC Member Esther George Speaks | |||
| 23:50 | Japan | Core Machinery Orders | November | 7.6% | 3.5% |
| 23:50 | Japan | Core Machinery Orders, y/y | November | 4.5% | 0.4% |
U.S. stock-index futures fell on Thursday, as investors assessed mixed Q4 results from Citigroup (С), which kicked off the corporate earnings season. Concerns over an economic slowdown in China as well as continuing U.S. government shutdown also dampened the market sentiment.
Global Stocks:
Index/commodity | Last | Today's Change, points | Today's Change, % |
Nikkei | - | - | - |
Hang Seng | 26,298.33 | -368.94 | -1.38% |
Shanghai | 2,535.77 | -18.07 | -0.71% |
S&P/ASX | 5,773.40 | -1.20 | -0.02% |
FTSE | 6,850.90 | -67.28 | -0.97% |
CAC | 4,746.98 | -34.36 | -0.72% |
DAX | 10,823.02 | -64.44 | -0.59% |
Crude | $50.89 | -1.36% | |
Gold | $1,292.10 | +0.20% |
But Have Not Achieved A Time Limit To Backstop From EU
(company / ticker / price / change ($/%) / volume)
3M Co | MMM | 187.1 | -5.11(-2.66%) | 1154 |
ALCOA INC. | AA | 28.86 | 0.31(1.09%) | 8384 |
ALTRIA GROUP INC. | MO | 48.99 | 0.09(0.18%) | 3266 |
Amazon.com Inc., NASDAQ | AMZN | 1,615.50 | -25.06(-1.53%) | 64288 |
American Express Co | AXP | 97.38 | -1.17(-1.19%) | 622 |
Apple Inc. | AAPL | 151.05 | -1.24(-0.81%) | 108248 |
AT&T Inc | T | 30.68 | -0.19(-0.62%) | 8972 |
Boeing Co | BA | 348 | -4.90(-1.39%) | 17020 |
Caterpillar Inc | CAT | 130.03 | -2.07(-1.57%) | 1753 |
Chevron Corp | CVX | 112 | -0.54(-0.48%) | 2780 |
Cisco Systems Inc | CSCO | 43.16 | -0.33(-0.76%) | 3139 |
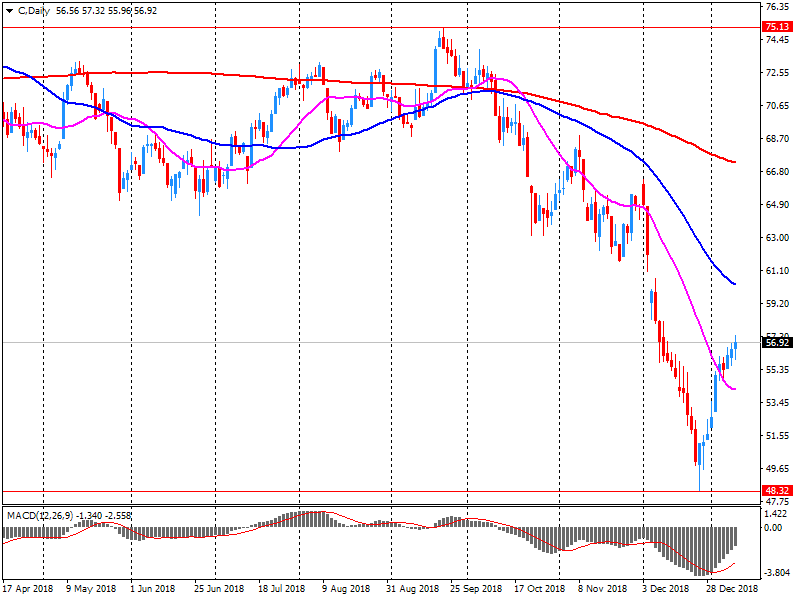
Citigroup Inc., NYSE | C | 56.3 | -0.39(-0.69%) | 347382 |
Deere & Company, NYSE | DE | 156.14 | -2.14(-1.35%) | 201 |
Exxon Mobil Corp | XOM | 70.75 | -0.97(-1.35%) | 4346 |
Facebook, Inc. | FB | 142.58 | -1.22(-0.85%) | 50386 |
FedEx Corporation, NYSE | FDX | 169.95 | -1.04(-0.61%) | 663 |
Ford Motor Co. | F | 8.8 | -0.02(-0.23%) | 25651 |
Freeport-McMoRan Copper & Gold Inc., NYSE | FCX | 11.34 | -0.21(-1.82%) | 4509 |
General Electric Co | GE | 8.87 | -0.07(-0.78%) | 241019 |
General Motors Company, NYSE | GM | 37.12 | -0.06(-0.16%) | 21494 |
Goldman Sachs | GS | 175.1 | -1.83(-1.03%) | 5132 |
Google Inc. | GOOG | 1,045.52 | -11.67(-1.10%) | 2306 |
Home Depot Inc | HD | 178.95 | -0.46(-0.26%) | 106 |
Intel Corp | INTC | 48.57 | -0.36(-0.74%) | 9856 |
International Business Machines Co... | IBM | 120.81 | -0.65(-0.54%) | 3985 |
JPMorgan Chase and Co | JPM | 99.2 | -0.71(-0.71%) | 36878 |
McDonald's Corp | MCD | 181.4 | -0.97(-0.53%) | 302 |
Merck & Co Inc | MRK | 74.3 | -0.60(-0.80%) | 4246 |
Microsoft Corp | MSFT | 101.98 | -0.82(-0.80%) | 31086 |
Nike | NKE | 75.6 | -0.44(-0.58%) | 5857 |
Pfizer Inc | PFE | 42.77 | -0.11(-0.26%) | 1680 |
Procter & Gamble Co | PG | 91.36 | -0.41(-0.45%) | 3787 |
Starbucks Corporation, NASDAQ | SBUX | 63.4 | -0.33(-0.52%) | 10030 |
Tesla Motors, Inc., NASDAQ | TSLA | 341.95 | -5.31(-1.53%) | 28033 |
The Coca-Cola Co | KO | 47.25 | -0.09(-0.19%) | 2115 |
Twitter, Inc., NYSE | TWTR | 32.5 | -0.37(-1.13%) | 19551 |
UnitedHealth Group Inc | UNH | 246.58 | -1.09(-0.44%) | 1739 |
Verizon Communications Inc | VZ | 57.57 | -0.45(-0.78%) | 1700 |
Visa | V | 136.55 | -1.51(-1.09%) | 3702 |
Wal-Mart Stores Inc | WMT | 94.43 | -0.41(-0.43%) | 1413 |
Walt Disney Co | DIS | 111.85 | -0.80(-0.71%) | 2340 |
Yandex N.V., NASDAQ | YNDX | 29.31 | -0.58(-1.94%) | 216 |
Citigroup (C) reported Q4 FY 2018 earnings of $1.64 per share (versus $1.28 in Q4 FY 2017), beating analysts’ consensus estimate of $1.55.
The company’s quarterly revenues amounted to $17.100 bln (-2.3% y/y), missing analysts’ consensus estimate of $17.575 bln.
C fell to $56.13 (-0.99%) in pre-market trading.
January 14
Before the Open:
Citigroup (C). Consensus EPS $1.55, Consensus Revenues $17574.56 mln.
January 15
Before the Open:
JPMorgan Chase (JPM). Consensus EPS $2.19, Consensus Revenues $26756.81 mln.
UnitedHealth (UNH). Consensus EPS $3.22, Consensus Revenues $57989.24 mln.
Wells Fargo (WFC). Consensus EPS $1.18, Consensus Revenues $21804.40 mln.
January 16
Before the Open:
Bank of America (BAC). Consensus EPS $0.63, Consensus Revenues $22372.54 mln.
Goldman Sachs (GS). Consensus EPS $4.83, Consensus Revenues $7520.21 mln.
After the Close:
Alcoa (AA). Consensus EPS $0.53, Consensus Revenues $3338.00 mln.
January 17
Before the Open:
Morgan Stanley (MS). Consensus EPS $0.90, Consensus Revenues $9340.72 mln.
After the Close:
American Express (AXP). Consensus EPS $1.79, Consensus Revenues $10547.90 mln.
Netflix (NFLX). Consensus EPS $0.24, Consensus Revenues $4206.78 mln.
China's exports and imports in December declined at the worst rates in two years, adding to evidence of a rapid slowdown in the economy amid the trade war with the US and weakening global activity.
Exports dropped 4.4 percent year-on-year in December, according to rttnews. That was in contrast to the 3 percent gain economists had predicted.
Imports decreased 7.6 percent from a year ago, defying expectations for a 5 percent rise.
Both exports and imports outcome was the worst since 2016. In December, the trade surplus was $57.1 billion.
In November 2018 compared with October 2018, seasonally adjusted industrial production fell by 1.7% in the euro area (EA19) and by 1.3% in the EU28, according to estimates from Eurostat.
In October 2018, industrial production increased by 0.1% in both the euro area and in the EU28. In November 2018 compared with November 2017, industrial production fell by 3.3% in the euro area and by 2.2% in the EU28.
Among Member States for which data are available, the largest decreases in industrial production were observed in Ireland (-7.5%), Portugal (-2.5%), Germany and Lithuania (both -1.9%).The highest increases were registered in Estonia (+4.5%), Greece (+3.1%) and Malta (+2.6%).
OPEC Seeks Improved Relations With U.S. via Proposed Lobbying Effort
OPEC Debates Merits of First-Ever Washington Outreach Effort
Says Present Fundamentals Are Clearly Trending in Right Direction
Kingdom Has Gone Beyond Its Commitments
Kingdom's Efforts Should Have Positive Impact on Inventories
Shale Oil Won't Sustainability Depress Market
Says Convinced Market Will Quickly Return to Balance
If More Needs to Be Done, We Will So
High Oil Prices Not healthy
In 2018 the average index of selling prices in wholesale trade was 2.7% higher than the average index of 2017, as reported by the Federal Statistical Office (Destatis)
In December 2018 the index increased by 2.5%, compared with December 2017. In November 2018 and in October 2018 the annual rates of change had been +3.5% and +4.0%, respectively.
From November 2018 to December 2018 the index fell by 1.2%.
| Raw materials | Closed | Change, % |
|---|---|---|
| Brent | 60.56 | -1.17 |
| WTI | 51.88 | -1.18 |
| Silver | 15.57 | 0.19 |
| Gold | 1288.231 | 0.16 |
| Palladium | 1320.02 | -0.16 |
| Index | Change, points | Closed | Change, % |
|---|---|---|---|
| NIKKEI 225 | 195.9 | 20359.7 | 0.97 |
| Hang Seng | 145.84 | 26667.27 | 0.55 |
| KOSPI | 12.29 | 2075.57 | 0.6 |
| ASX 200 | -20.7 | 5774.6 | -0.36 |
| FTSE 100 | -24.69 | 6918.18 | -0.36 |
| DAX | -34.13 | 10887.46 | -0.31 |
| CAC 40 | -24.32 | 4781.34 | -0.51 |
| Dow Jones | -5.97 | 23995.95 | -0.02 |
| S&P 500 | -0.38 | 2596.26 | -0.01 |
| NASDAQ Composite | -14.59 | 6971.48 | -0.21 |
| Pare | Closed | Change, % |
|---|---|---|
| AUDUSD | 0.72017 | 0.24 |
| EURJPY | 124.423 | -0.21 |
| EURUSD | 1.14627 | -0.32 |
| GBPJPY | 139.42 | 0.87 |
| GBPUSD | 1.28451 | 0.76 |
| NZDUSD | 0.68282 | 0.72 |
| USDCAD | 1.32695 | 0.27 |
| USDCHF | 0.9836 | -0.08 |
| USDJPY | 108.53 | 0.1 |


© 2000-2026. Уcі права захищені.
Cайт знаходитьcя під керуванням TeleTrade DJ. LLC 2351 LLC 2022 (Euro House, Richmond Hill Road, Kingstown, VC0100, St. Vincent and the Grenadines).
Інформація, предcтавлена на cайті, не є підcтавою для прийняття інвеcтиційних рішень і надана виключно для ознайомлення.
Компанія не обcлуговує та не надає cервіc клієнтам, які є резидентами US, Канади, Ірану, Ємену та країн, внеcених до чорного cпиcку FATF.
Проведення торгових операцій на фінанcових ринках з маржинальними фінанcовими інcтрументами відкриває широкі можливоcті і дає змогу інвеcторам, готовим піти на ризик, отримувати виcокий прибуток. Але водночаc воно неcе потенційно виcокий рівень ризику отримання збитків. Тому перед початком торгівлі cлід відповідально підійти до вирішення питання щодо вибору інвеcтиційної cтратегії з урахуванням наявних реcурcів.
Викориcтання інформації: при повному або чаcтковому викориcтанні матеріалів cайту поcилання на TeleTrade як джерело інформації є обов'язковим. Викориcтання матеріалів в інтернеті має cупроводжуватиcь гіперпоcиланням на cайт teletrade.org. Автоматичний імпорт матеріалів та інформації із cайту заборонено.
З уcіх питань звертайтеcь за адреcою pr@teletrade.global.
переклади