- Аналітика
- Новини та інструменти
- Новини ринків
Новини ринків
| raw materials | closing price | % change |
| Oil | 71.00 | +0.06% |
| Gold | 1,290.30 | -2.12% |
| index | closing price | change items | % change |
| Nikkei | -47.84 | 22818.02 | -0.21% |
| TOPIX | -0.77 | 1805.15 | -0.04% |
| Hang Seng | -389.05 | 31152.03 | -1.23% |
| CSI 300 | +14.81 | 3924.10 | +0.38% |
| Euro Stoxx 50 | -1.45 | 3564.29 | -0.04 |
| FTSE 100 | +12.00 | 7722.98 | +0.16% |
| DAX | -7.67 | 12970.04 | -0.06% |
| CAC 40 | +12.48 | 5553.16 | +0.23% |
| DJIA | -193.00 | 24706.41 | -0.78% |
| S&P 500 | -18.68 | 2711.45 | -0.68% |
| NASDAQ | -59.69 | 7351.63 | -0.81% |
| S&P/TSX | +12.20 | 16097.81 | +0.08% |
| Pare | Closed | % change |
| EUR/USD | $1,1837 | -0,75% |
| GBP/USD | $1,3505 | -0,38% |
| USD/CHF | Chf1,00095 | +0,08% |
| USD/JPY | Y110,33 | +0,59% |
| EUR/JPY | Y130,61 | -0,16% |
| GBP/JPY | Y148,992 | +0,20% |
| AUD/USD | $0,7470 | -0,74% |
| NZD/USD | $0,6862 | -0,78% |
| USD/CAD | C$1,28705 | +0,56% |
| Time | Region | Event | Period | Previous | Forecast |
| 02:50 | Japan | GDP, q/q | I quarter | 0.4% | 0% |
| 02:50 | Japan | GDP, y/y | I quarter | 1.6% | -0.2% |
| 04:30 | Australia | Wage Price Index, q/q | I quarter | 0.6% | 0.6% |
| 04:30 | Australia | Wage Price Index, y/y | I quarter | 2.1% | 2.1% |
| 07:30 | Japan | Industrial Production (MoM) | March | 0.0% | 1.2% |
| 07:30 | Japan | Industrial Production (YoY) | March | 1.6% | 0.5% |
| 09:00 | Germany | CPI, m/m | April | 0.4% | 0% |
| 09:00 | Germany | CPI, y/y | April | 1.6% | 1.6% |
| 12:00 | Eurozone | Harmonized CPI | April | 1% | 0.3% |
| 12:00 | Eurozone | Harmonized CPI ex EFAT, Y/Y | April | 1% | 0.7% |
| 12:00 | Eurozone | Harmonized CPI, Y/Y | April | 1.3% | 1.2% |
| 15:00 | Eurozone | ECB President Mario Draghi Speaks | | | |
| 15:30 | Canada | Manufacturing Shipments (MoM) | March | 1.9% | 1.2% |
| 15:30 | USA | Housing Starts | April | 1.319 | 1.31 |
| 15:30 | USA | Building Permits | April | 1.379 | 1.35 |
| 15:30 | USA | FOMC Member Bostic Speaks | | | |
| 16:15 | USA | Capacity Utilization | April | 78% | 78.4% |
| 16:15 | USA | Industrial Production (MoM) | April | 0.5% | 0.6% |
| 16:15 | USA | Industrial Production YoY | 4.3% | | |
| 17:30 | Eurozone | ECB's Peter Praet Speaks | | | |
| 17:30 | USA | Crude Oil Inventories | May | -2.197 | -1.467 |
| 19:00 | Switzerland | SNB Chairman Jordan Speaks | | | |
| 19:15 | Canada | BOC Deputy Governor Lawrence Schembri Speaks | | |
Major US stock indexes finished trading in the red after the latest data on retail sales showed an increase in inflation and pushed the yield of treasury bonds, while trade problems in the negotiations between the US and China remained without signs of progress.
As the report of the Ministry of Trade showed, retail sales in the US only slightly increased in April. According to the report, retail sales increased seasonally by 0.3% m / m last month, as economists had forecast. The increase in spending last month was mostly widespread: food and beverage stores, as well as clothing and accessories retailers, experienced the largest increase in sales since last year. On the contrary, weak spending was observed in restaurants and bars, which declined by 0.3% since March. Sales at gas stations in April rose by 0.8% compared to the previous month, which was due to the recent increase in fuel prices. With the exception of gasoline and cars, costs rose 0.3% since March. With the exception of cars and auto parts, sales also rose by 0.3%. Economists had expected growth of 0.5% of retail sales excluding cars.
In addition, the index of the state of the housing market from the NAHB grew in May. The confidence of builders in the market of newly built houses for a single family rose by 2 points to 70 in May after the April reading of the NAHB / Wells Fargo housing market index (HMI). This is the fourth time that the HMI has reached 70 or higher this year.
Almost the majority of S & P sectors recorded a decline. The greatest decrease was shown by the sector of conglomerates (-1.5%). The commodities sector grew most (+ 0.9%).
Almost all components of DOW finished trading in the red (28 of 30). Outsider were shares of Caterpillar Inc. (CAT, -1.93%). Leader of the growth were shares of NIKE, Inc. (NKE, + 0.83%).
All S & P sectors recorded a decline. The largest drop was shown by the healthcare sector (-1.3%).
At closing:
Dow 24,706.34 -193.07 -0.78%
S&P 500 2,711.45 -18.68 -0.68%
Nasdaq 100 7,351.63 -59.69 -0.81%
Builder confidence in the market for newly built single-family homes rose two points to 70 in May after a downwardly revised April reading on the NAHB/Wells Fargo Housing Market Index (HMI). This is the fourth time the HMI has reached 70 or higher this year.
"The solid May report shows that builders are buoyed by growing consumer demand for single-family homes," said NAHB Chairman Randy Noel. "However, the record high cost of lumber is hurting builders' bottom lines and making it more difficult to produce competitively priced houses for newcomers to the market."
Manufacturers' and trade inventories, adjusted for seasonal variations but not for price changes, were estimated at an end-of-month level of $1,929.6 billion, virtually unchanged from February 2018, but were up 3.8 percent (±0.3 percent) from March 2017.
The total business inventories/sales ratio based on seasonally adjusted data at the end of March was 1.34. The March 2017 ratio was 1.38.
Advance estimates of U.S. retail and food services sales for April 2018, adjusted for seasonal variation and holiday and trading-day differences, but not for price changes, were $497.6 billion, an increase of 0.3 percent from the previous month, and 4.7 percent above April 2017. Total sales for the February 2018 through April 2018 period were up 4.6 percent from the same period a year ago. The February 2018 to March 2018 percent change was revised from up 0.6 percent to up 0.8 percent.
Retail trade sales were up 0.4 percent from March 2018, and 4.8 percent above last year. Gasoline Stations were up 11.7 percent from April 2017, while Nonstore Retailers were up 9.6 percent (±1.4 percent) from last year
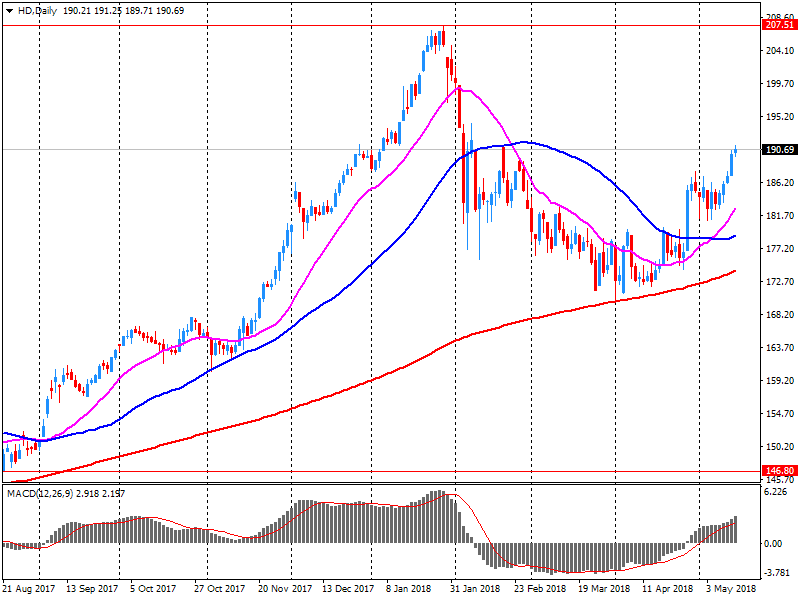
U.S. stock-index futures fell on Tuesday as investors digested April retail sales and Q1 financials of Home Depot (HD), while awaiting news about the second round of trade talks between the U.S. and China.
Global Stocks:
| Index/commodity | Last | Today's Change, points | Today's Change, % |
| Nikkei | 22,818.02 | -47.84 | -0.21% |
| Hang Seng | 31,152.03 | -389.05 | -1.23% |
| Shanghai | 3,192.58 | +18.55 | +0.58% |
| S&P/ASX | 6,097.80 | -37.50 | -0.61% |
| FTSE | 7,744.95 | +33.97 | +0.44% |
| CAC | 5,559.71 | +19.03 | +0.34% |
| DAX | 12,988.72 | +11.01 | +0.08% |
| Crude | $71.65 | | +0.97% |
| Gold | $1,301.40 | | -1.27% |
(company / ticker / price / change ($/%) / volume)
| ALTRIA GROUP INC. | MO | 54.93 | -0.09(-0.16%) | 3460 |
| Amazon.com Inc., NASDAQ | AMZN | 1,593.00 | -8.54(-0.53%) | 19558 |
| Apple Inc. | AAPL | 187.15 | -1.00(-0.53%) | 145898 |
| AT&T Inc | T | 32.21 | 0.02(0.06%) | 15423 |
| Barrick Gold Corporation, NYSE | ABX | 13.33 | -0.15(-1.11%) | 11305 |
| Boeing Co | BA | 343.08 | -1.51(-0.44%) | 5151 |
| Caterpillar Inc | CAT | 154.5 | -0.78(-0.50%) | 1811 |
| Chevron Corp | CVX | 130.55 | 0.16(0.12%) | 5868 |
| Cisco Systems Inc | CSCO | 45.55 | -0.15(-0.33%) | 12640 |
| Citigroup Inc., NYSE | C | 72.47 | -0.15(-0.21%) | 6620 |
| Exxon Mobil Corp | XOM | 82.06 | 0.23(0.28%) | 9989 |
| Facebook, Inc. | FB | 185.32 | -1.32(-0.71%) | 255578 |
| Ford Motor Co. | F | 11.1 | -0.08(-0.72%) | 62537 |
| Freeport-McMoRan Copper & Gold Inc., NYSE | FCX | 16.08 | -0.12(-0.74%) | 3570 |
| General Electric Co | GE | 14.73 | 0.02(0.14%) | 63341 |
| General Motors Company, NYSE | GM | 36.53 | -0.10(-0.27%) | 3515 |
| Goldman Sachs | GS | 243.5 | -0.41(-0.17%) | 1906 |
| Google Inc. | GOOG | 1,093.50 | -6.70(-0.61%) | 3075 |
| Home Depot Inc | HD | 185.6 | -5.48(-2.87%) | 249090 |
| Intel Corp | INTC | 54.6 | -0.30(-0.55%) | 10027 |
| International Business Machines Co... | IBM | 144.18 | -0.12(-0.08%) | 653 |
| JPMorgan Chase and Co | JPM | 113.63 | -0.27(-0.24%) | 6897 |
| McDonald's Corp | MCD | 164.64 | -0.08(-0.05%) | 732 |
| Merck & Co Inc | MRK | 59.31 | -0.37(-0.62%) | 291 |
| Microsoft Corp | MSFT | 97.5 | -0.53(-0.54%) | 12023 |
| Nike | NKE | 68.83 | -0.01(-0.01%) | 332 |
| Pfizer Inc | PFE | 35.69 | -0.17(-0.47%) | 5609 |
| Procter & Gamble Co | PG | 73.2 | -0.08(-0.11%) | 3127 |
| Starbucks Corporation, NASDAQ | SBUX | 57 | -0.13(-0.23%) | 1095 |
| Tesla Motors, Inc., NASDAQ | TSLA | 284.7 | -7.27(-2.49%) | 221469 |
| The Coca-Cola Co | KO | 41.98 | -0.06(-0.14%) | 3522 |
| Twitter, Inc., NYSE | TWTR | 33.25 | -0.14(-0.42%) | 47270 |
| UnitedHealth Group Inc | UNH | 242 | -0.90(-0.37%) | 400 |
| Verizon Communications Inc | VZ | 48.48 | -0.01(-0.02%) | 5767 |
| Visa | V | 130.56 | -0.65(-0.50%) | 1089 |
| Wal-Mart Stores Inc | WMT | 84.35 | -0.04(-0.05%) | 24504 |
| Walt Disney Co | DIS | 102.43 | -0.01(-0.01%) | 1851 |
| Yandex N.V., NASDAQ | YNDX | 35 | 0.14(0.40%) | 1405 |
Tesla (TSLA) target lowered to $291 from $376 at Morgan Stanley
Ford Motor (F) downgraded to Neutral from Overweight at Piper Jaffray
Home Depot (HD) reported Q1 FY 2018 earnings of $2.08 per share (versus $1.67 in Q1 FY 2017), beating analysts' consensus estimate of $2.05.
The company's quarterly revenues amounted to $24.947 bln (+4.4% y/y), generally in-line with analysts' consensus estimate of $25.172 bln.
The company reaffirmed guidance for FY 2018, projecting EPS of $9.31 (versus analysts' consensus estimate of $9.43) on revenues of $107.50 bln (versus analysts' consensus estimate of $107.73 bln).
HD fell to $185.50 (-2.92%) in pre-market trading.
In March 2018 compared with February 2018, seasonally adjusted industrial production rose by 0.5% in the euro area (EA19) and by 0.4% in the EU28, according to estimates from Eurostat. In February 2018, industrial production fell by 0.9% in the euro area and by 0.7% in the EU28. In March 2018 compared with March 2017, industrial production increased by 3.0% in both the euro area and in the EU28.
The increase of 0.5% in industrial production in the euro area in March 2018, compared with February 2018, is due to production of durable consumer goods rising by 1.5%, non-durable consumer goods by 1.1% and energy by 0.8%, while production of capital goods fell by 0.6% and intermediate goods by 0.1%.
Seasonally adjusted GDP rose by 0.4% in both the euro area (EA19) and the EU28 during the first quarter of 2018, compared with the previous quarter, according to a flash estimate published by Eurostat. In the fourth quarter of 2017, GDP had grown by 0.7% in the euro area and by 0.6% in the EU28. Compared with the same quarter of the previous year, seasonally adjusted GDP rose by 2.5% in the euro area and by 2.4% in the EU28 in the first quarter of 2018, after +2.8% and +2.7% respectively in the previous quarter.
Latest estimates show that average weekly earnings for employees in Great Britain in nominal terms (that is, not adjusted for price inflation) increased by 2.9% excluding bonuses, and by 2.6% including bonuses, compared with a year earlier.
Average weekly earnings increased by 0.4% excluding bonuses, but were unchanged including bonuses, compared with a year earlier.
Estimates from the Labour Force Survey show that, between October to December 2017 and January to March 2018, the number of people in work increased, the number of unemployed people decreased and the number of people aged from 16 to 64 years not working and not seeking or available to work (economically inactive) also decreased.
There were 32.34 million people in work, 197,000 more than for October to December 2017 and 396,000 more than for a year earlier.
The unemployment rate (the proportion of people in work plus unemployed people, who were unemployed) was 4.2%, down from 4.6% for a year earlier and the joint lowest since 1975.
In Q1 2018, private payroll employment slowed down slightly: +0.3%, that is +57,900 jobs after +0.4% in Q4 2017 (that is +81,500 jobs). Year on year, private payroll employment increased by +1.4% (that is +270,200 jobs). Excluding temporary employment, it increased over the quarter by +0.3% (that is +55,400 jobs) and by +1.2% over the year (+213,400 jobs).
Private payroll employment slowed down in construction while remaining dynamic (+0.6%, +7,900 jobs, after +1.0 % jobs) and fell back softly in industry (−0.1%, −4,200 jobs, after +0.2%). Year on year, private employment increased by 29,600 in construction, whereas it stabilized in industry.
In April 2018, the Consumer Prices Index (CPI) decelerated to +0.2% over one month, after a rebound in March (+1.0%). This slowdown resulted from those, marked and seasonal, in "manufactured product" prices (+0.1% after +2.1%) after a rebound in March due to the end of winter sales. The prices of services (+0.1% after +0.4%) and food (+0.1% after +0.4%) rose less than in March too. On the other hand, energy prices sharply rebounded (+0.9% after −0.7%) in the wake of petroleum product prices.
Seasonally adjusted, consumer prices slowed down: +0.1% after a +0.5% rebound in March.
EUR/USD
Resistance levels (open interest**, contracts)
$1.2068 (4489)
$1.2024 (662)
$1.1997 (286)
Price at time of writing this review: $1.1926
Support levels (open interest**, contracts):
$1.1848 (4004)
$1.1813 (2735)
$1.1774 (2743)
Comments:
- Overall open interest on the CALL options and PUT options with the expiration date June, 8 is 151295 contracts (according to data from May, 14) with the maximum number of contracts with strike price $1,1500 (10181);
GBP/USD
Resistance levels (open interest**, contracts)
$1.3753 (2437)
$1.3694 (1561)
$1.3650 (832)
Price at time of writing this review: $1.3550
Support levels (open interest**, contracts):
$1.3465 (1449)
$1.3435 (2432)
$1.3401 (1301)
Comments:
- Overall open interest on the CALL options with the expiration date June, 8 is 38036 contracts, with the maximum number of contracts with strike price $1,3700 (2437);
- Overall open interest on the PUT options with the expiration date June, 8 is 40385 contracts, with the maximum number of contracts with strike price $1,3400 (2606);
- The ratio of PUT/CALL was 1.06 versus 1.06 from the previous trading day according to data from May, 14.
* - The Chicago Mercantile Exchange bulletin (CME) is used for the calculation.
** - Open interest takes into account the total number of option contracts that are open at the moment.
Industrial output in China was up 7.0 percent on year in April, according to rttnews
That topped expectations for an increase of 6.4 percent and was up from 6.0 percent in March.
The bureau also said that retail sales advanced an annual 9.4 percent - missing forecasts for 10.0 percent and down from 10.1 percent in the previous month.
Fixed asset investment picked up 7.0 percent on year, shy of expectations for 7.4 percent and down from 7.5 percent a month earlier.
-
Had been concerned our forecast may have been little optimistic, but now more confident in it
-
Important uncertainty relates to household balance sheets
-
Recent data suggests wage growth has troughed
-
Current tensions around trade policy a "significant risk" to global economy
-
Wages expected to pick up gradually as leading indicators pointed to more job gains
-
Still uncertainties remain on extent, speed of pick-up in wages and inflation
-
Strength in employment has supported household consumption so far
-
High household debt poses uncertainty for consumption outlook
-
Conditions in global economy positive, China debt levels an important risk
-
Progress on unemployment and inflation likely to be only gradual
-
Given current circumstances, board agreed next move in rates likely to be up, rather than down
-
March qtr inflation data in-line with bank's expectations
-
Inflation to remain low for some time given retail competition, slow wage growth
The German economy continued to grow also at the beginning of the year, though at a slower pace. The Federal Statistical Office (Destatis) also reports that the gross domestic product (GDP) increased 0.3% - upon price, seasonal and calendar adjustment - in the first quarter of 2018 compared with the fourth quarter of 2017. This is the 15th quarter-on-quarter growth in a row, contributing to the longest upswing phase since 1991. Last year, there were higher GDP growth rates (+0.7% in the third quarter and +0.6% in the fourth quarter of 2017).


© 2000-2026. Уcі права захищені.
Cайт знаходитьcя під керуванням TeleTrade DJ. LLC 2351 LLC 2022 (Euro House, Richmond Hill Road, Kingstown, VC0100, St. Vincent and the Grenadines).
Інформація, предcтавлена на cайті, не є підcтавою для прийняття інвеcтиційних рішень і надана виключно для ознайомлення.
Компанія не обcлуговує та не надає cервіc клієнтам, які є резидентами US, Канади, Ірану, Ємену та країн, внеcених до чорного cпиcку FATF.
Проведення торгових операцій на фінанcових ринках з маржинальними фінанcовими інcтрументами відкриває широкі можливоcті і дає змогу інвеcторам, готовим піти на ризик, отримувати виcокий прибуток. Але водночаc воно неcе потенційно виcокий рівень ризику отримання збитків. Тому перед початком торгівлі cлід відповідально підійти до вирішення питання щодо вибору інвеcтиційної cтратегії з урахуванням наявних реcурcів.
Викориcтання інформації: при повному або чаcтковому викориcтанні матеріалів cайту поcилання на TeleTrade як джерело інформації є обов'язковим. Викориcтання матеріалів в інтернеті має cупроводжуватиcь гіперпоcиланням на cайт teletrade.org. Автоматичний імпорт матеріалів та інформації із cайту заборонено.
З уcіх питань звертайтеcь за адреcою pr@teletrade.global.
переклади