- Аналітика
- Новини та інструменти
- Новини ринків
Новини ринків
- AUD/USD gains 0.34% on positive sentiment, defying a negative housing market report impact.
- Neutral bias with an upside tilt; breach of 200-DMA at 0.6579 may target 0.6600 and 0.6639.
- Downside risks include 200-DMA at 0.6579 and the January 17 low of 0.6523 before testing 0.6500.
The Australian Dollar (AUD) registers solid gains from the US Dollar (USD) amid an upbeat market mood following the release of an improvement in consumer sentiment and a bad housing market report. At the time of writing, the AUD/USD exchanges hands at 0.6373, gains 0.34%.
The daily chart portrays the pair as neutral biased, though tilted to the upside, after breaking above the 200-day moving average (DMA) at 0.6579. Further upside is seen at 0.6600, followed by the 50-day moving average (DMA) at 0.6639. Once surpassed, the next stop would be the January 12 cycle high at turned resistance at 0.6728.
For a bearish resumption, AUD/USD first support would be the 200-DMA at 0.6579, followed by the January 17 daily low of 0.6523. A drop below that level, and sellers could challenge the 0.6500 figure
AUD/USD Price Action – Daily Chart
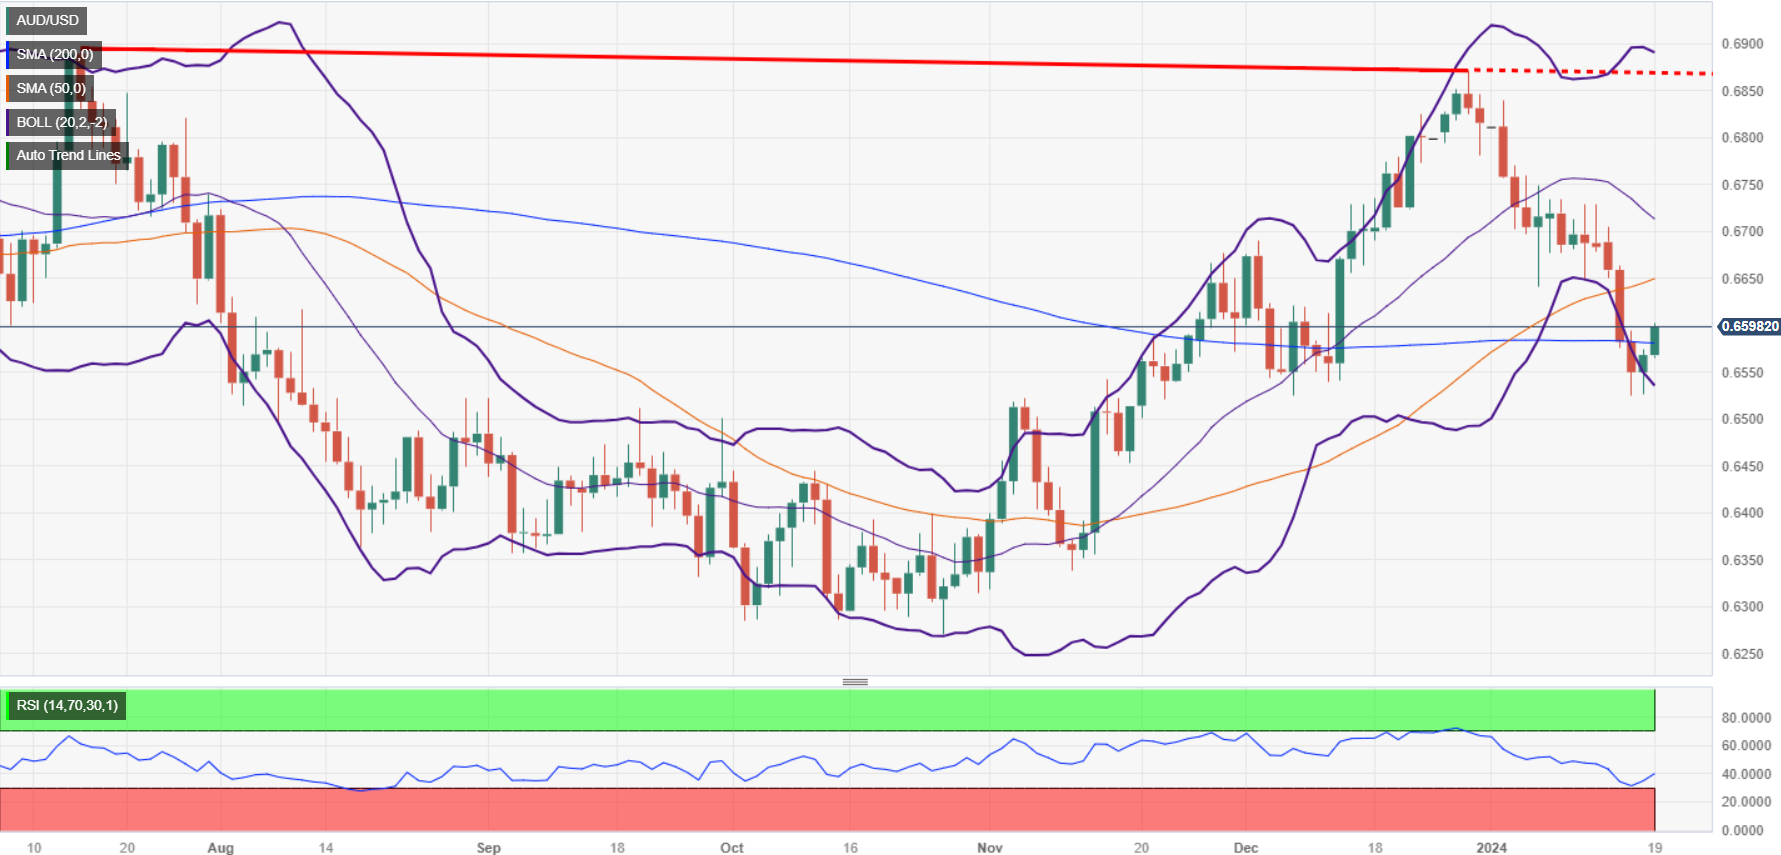
AUD/USD Technical Levels
- US indexes climbed on Friday, led by chip makers.
- Investors have pivoted to tech shares to shake off Fed rate tantrum.
- Markets go haywire as the US Dollar, US equities, and Treasury yields all rise.
The Standard & Poor’s drove to a new all-time high of $4,839.58 on Friday as equities broadly rallied as investors pile into future earnings bets on large-cap tech stocks, with chip-makers loosely associated with AI tech projects leading the charge.
Money markets are broadly shaking off months of begrudgingly giving up ground on rate cut expectations from the Federal Reserve (Fed). According to the CME’s FedWatch tool, rate swap bets are pricing in nearly a 40% chance of a rate cut at the Fed’s March policy meeting, down significantly from over a 70% chance just a month ago.
Fed officials have been pushing back against market expectations of an increased pace of rate cuts from the US central bank, and markets appear to finally be listening as US economic data continues to thump market forecasts, printing consistently higher and healthier than investors were hoping for as markets yearn for cheaper lending and borrowing costs.
US Consumer Sentiment improved to its best reading since July of 2021 according to the University of Michigan’s consumer sentiment survey. The UoM’s 5-year Consumer Inflation Expectations Survey in January also declined to familiar lows at 2.8% from December’s 2.9%.
With the US economy continuing to bump along at a healthy clip and US consumers expecting inflation to remain above the Fed’s 2% target for the foreseeable future, market hopes of Fed rate cuts are unlikely to see a happy conclusion, with money markets now leaning into the FOMC’s May meeting as a possible start to the next cutting cycle.
The Dow Jones Industrial Average (DJIA) also rose to an all-time high, touching $37,931.36 and wrapping up Friday at $37,863.80, climbing over 395 points and gaining 1.05% on the day.
The NASDAQ Composite and NASDAQ 100 indexes hit their own all-time highs on Friday, with the NASDSAQ Composite climbing 255.32 to $15,310.97 to a Friday gain of 1.7% while the NASDAQ 100 soared 1.75% to end at $17,316.87, up over 296 points.
S&P 500 Technical Outlook
The S&P 500 major equity index climbed nearly one and a quarter percent to hit an all-time high of its own, ending Friday at $4,839.81, up 58.87 points on the day.
Near-term bullish momentum in equity indexes has sent the S&P well above any technical zones and pinning into record peaks. The S&P could decline over 8% and still be in bull country above the 200-day Simple Moving Average (SMA) near $4,400.00, and the closest technical barrier sits at the 50-day SMA near $4,650.00.
S&P 500 Hourly Chart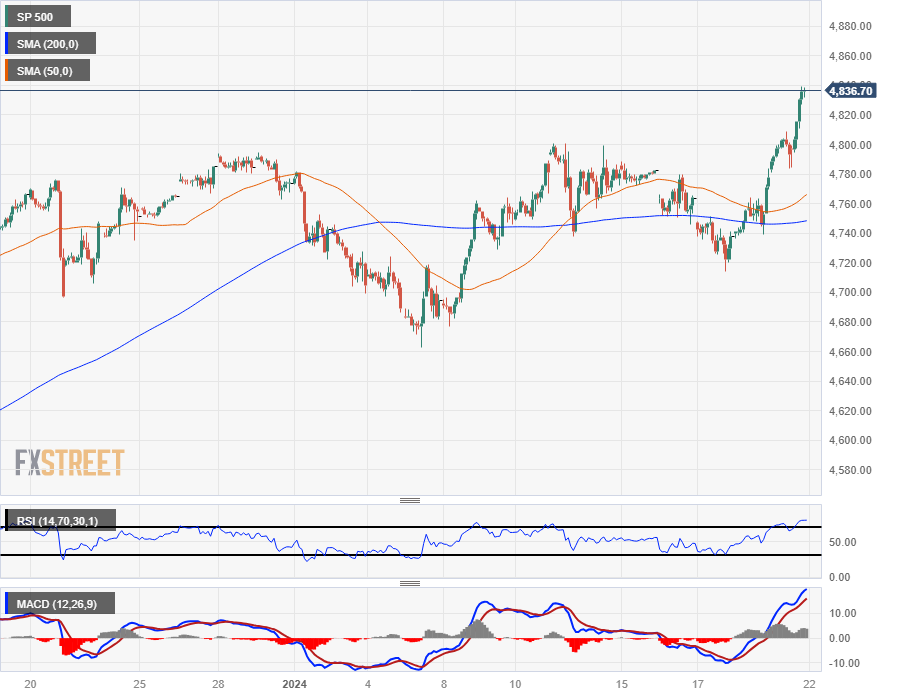
S&P 500 Daily Chart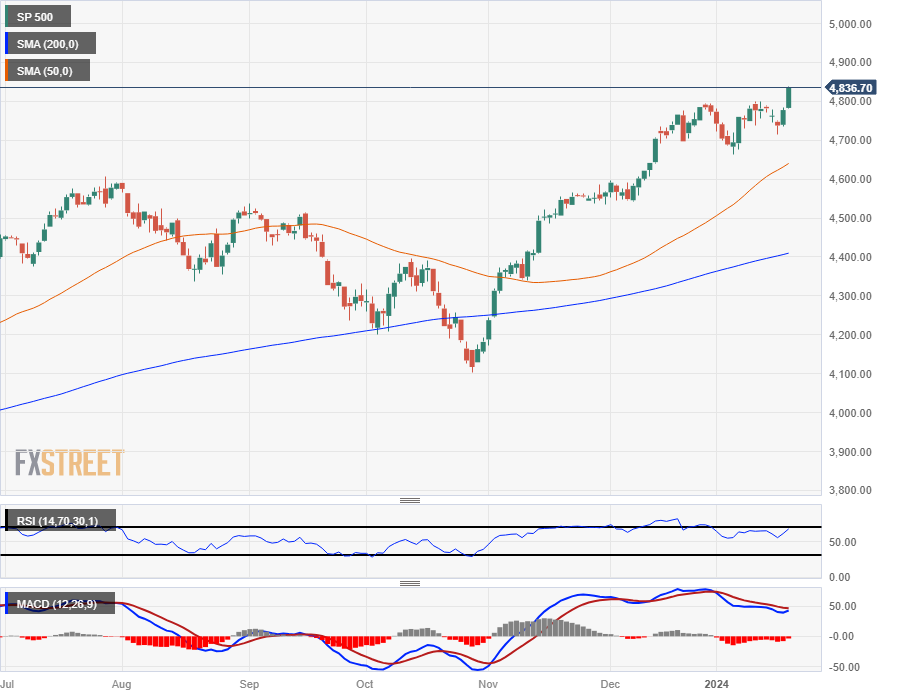
- Crude Oil markets pushed into a new high for the week before settling back on Friday.
- WTI roils between $74.50 and $73.00 on Friday.
- Freezing temperatures and geopolitical tensions weigh on supply concerns.
Crude Oil bids broadly rose over the week in jittery trading that saw frequent peaks and dips into highs and lows, with West Texas Intermediate (WTI) US Crude Oil settling the week near $73.60 with a 5.6% or $3 spread between the week’s late peak set late on Friday at $74.60 and Wednesday’s weekly low at $70.62.
Broad-market concerns about production caps from the Organization of the Petroleum Exporting Countries (OPEC) that plagued energy markets for much of the third quarter of 2023 have all but evaporated, being replaced by broad-market concerns that Iran-backed Houthi rebels attacking civilian ships in the Red Sea will hamper critical global supply lines between Europe and Asia.
Bullish Crude Oil prices on supply concerns have seen significant downside pressure crimp topside momentum, with the US hitting record levels of Crude Oil production in 2023 and on pace to continue ramping up barrel output looking forward.
Canada is also set to hit new production highs as Crude Oil producers in Alberta ramp up production as the Trans Mountain pipeline nears completion, which will make it easier for the oil-exporting country to add their raw light sweet crude oil supplies to the US’ logistics chain. As the fourth-largest global producer of Crude Oil, Canada stands poised to launch the US even further to the top of the leaderboard as a global net producer and exporter of downstream oil products.
Despite a historic overhang in partially-refined Crude Oil products, declines in near-term raw barrel supplies is drawing a line underneath barrel prices as energy markets await a more solidified outlook on global supply balances in Crude Oil.
WTI Technical Outlook
Choppy trading as markets get pulled in both directions leave Crude Oil traders strung along the midrange, with WTI testing familiar territory near the $74.00 handle. WTI has cycled the key price handle in a tightening pattern since descending into the neighborhood in early November, and a sideways grind in the WTI chart has the 50-day Simple Moving Average (SMA) descending into intraday territory.
The 200-day SMA is accelerating a downturn from the $78.00 handle, which will add bearish pressure to near-term price action to the low side if bulls can’t push WTI back over medium-term technical resistance at the $76.00 handle.
WTI Daily Chart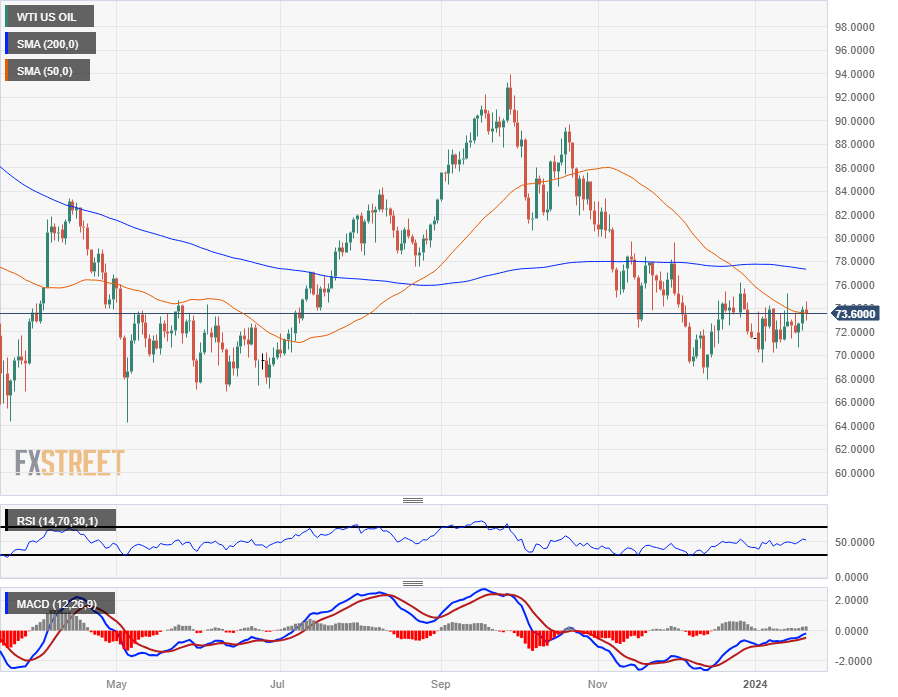
San Francisco Federal Reserve (Fed) President Mary C. Daly hit newswires for the second time on Friday, expanding on statements she made during an interview with Fox Business earlier in the day.
Read more: Fed's Daly says shifts in labor market could trigger policy adjustments
Key highlights:
- Fed policy remains in a good place, as does the US economy.
- Need to be patient, there's still plenty of work to do.
- Fed doesn't want to loosen policy too soon or try to squeeze out inflation too fast.
- 2024 will be a focus on policy calibration.
- Easing too quickly or before 2% target is reached would be too scarring.
- Goods and services prices are both coming down steadily.
- GBP/JPY fluctuates, impacted by Japanese CPI and weak UK retail sales; currently at 188.11.
- Bullish bias persists, but a close below 188.22 may trigger retracement towards 187.00 and potential support levels.
- Break above 188.00 sets the stage for further gains, targeting YTD high at 188.92 and potentially reaching 190.00.
GBP/JPY seesaws late in the North American session but is down 0.05% so far after trading within a 150 pips range courtesy of CPI data from Japan and weaker retail sales from the UK. Therefore, the pair traveled within its daily and eight-year high and low of 188.92/187.40 before settling at current exchange rates. At the time of writing, the cross trades at 188.11.
From a technical standpoint, the pair remains bullishly biased, but a daily close below January’s 18 one at 188.22 could initially open the door for a retracement toward the 187.00 figure. Further downside sentiment could drag the GBP/JPY exchange rate towards the Tenkan-Sen at 185.84 before challenging the Senkou Span A at 184.74.
On the contrary, a daily close above 188.00 could pave the way for further upside, with the year-to-date (YTD) high in place at 188.92, ahead of 189.00. Further upside is seen once those levels are cleared on its way to 190.00.
GBP/JPY Price Action – Daily Chart
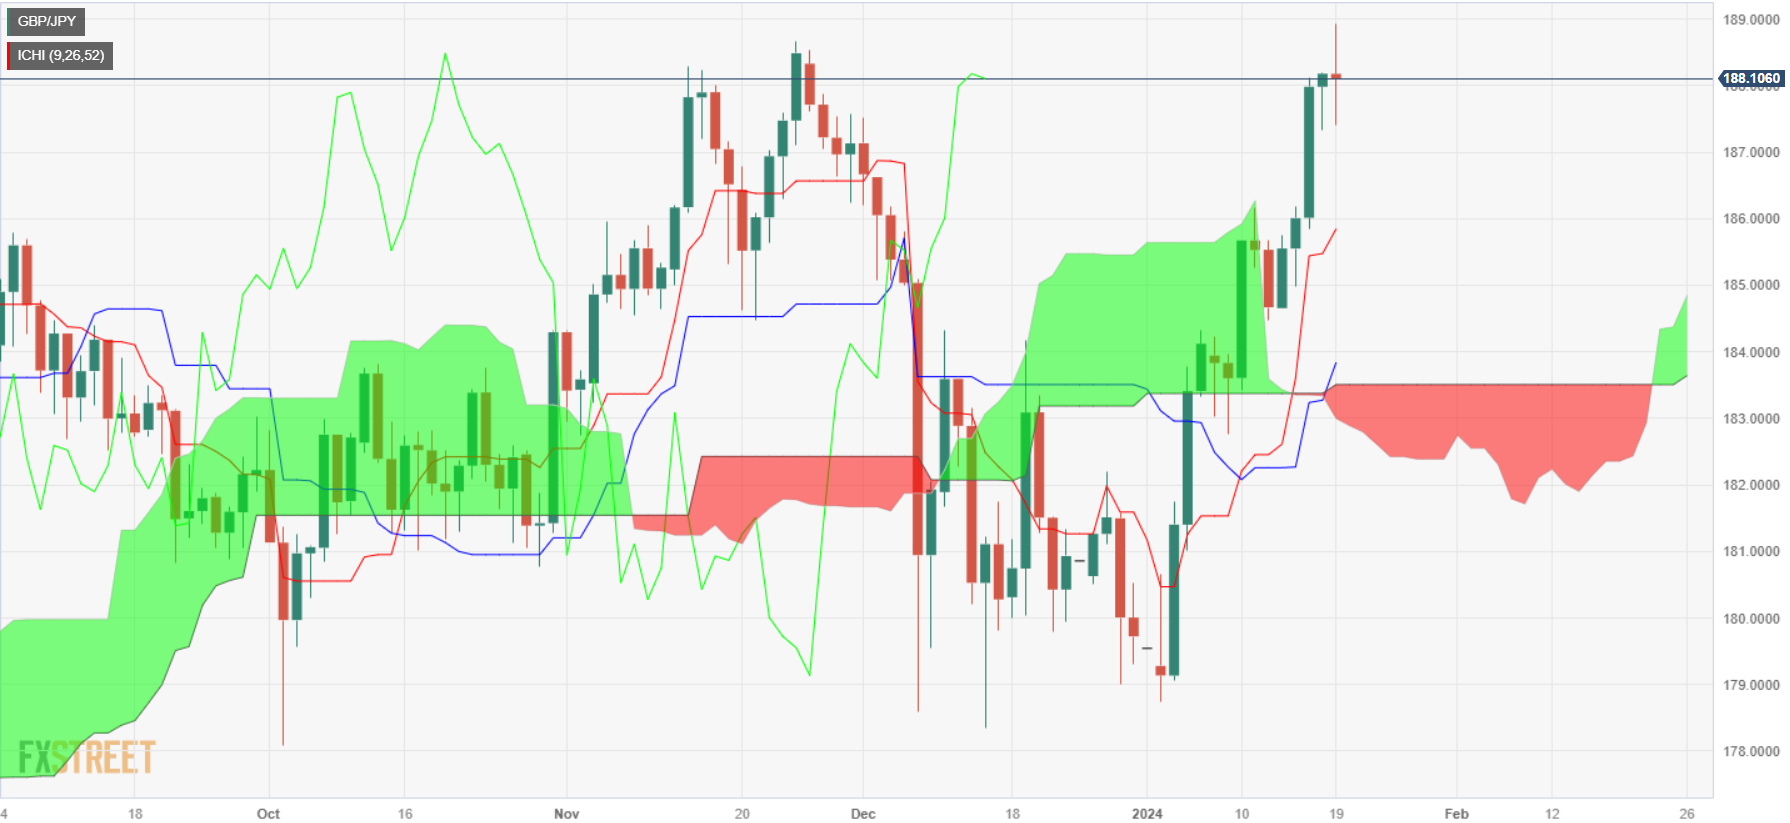
GBP/JPY Technical Levels
San Francisco Federal Reserve (Fed) President Mary C. Daly spoke about the Fed's policy outlook during an interview on Fox Business on Friday.
The San Francisco Fed President since 2018, Mary C. Daly will be rotating from an Alternate Member voting seat to a full Member for the 2024 Fed chair rotation when the Fed next meets on January 31, and she will directly vote on rate operations through the fiscal year.
Key highlights
- Fed's Daly: early signs of faltering in the labor market could trigger policy adjustments.
- It's also important to watch for any rises in delinquency rates as an early indicator of economic weakness.
- Fed needs to get inflation on a consistent trajectory to 2%, need further evidence to feel confident in rate adjustments.
- Markets are premature in thinking rate cuts are just around the corner.
- It is far too early to declare victory on inflation.
- AUD/JPY rises late in the session, supported by a risk-on sentiment fueled by Wall Street's advance.
- Buyers in control as the pair surpasses 97.00, aiming for a daily close above 98.00 for further gains.
- Despite the ascent, pullback risks persist; sellers may target levels below 97.00 for bearish momentum.
AUD/JPY edges higher late in Friday’s North American session, sponsored by a risk-on impulse, as the advance in Wall Street could appreciate it. Therefore, safe-haven peers are pressured while US Treasury yields retrace, a tailwind for riskier assets. At the time of writing, the AUD/JPY exchanged hands at 97.79, printing a new six-day high.
The pair began the week at around the lows of the week, below the Tenkan-Sen, but the AUD/JPY exchange rate was already above the Ichimoku Cloud (Kumo), suggesting that buyers were in charge. Consequently, they reclaimed 97.00 and, on Friday, extended its gains. Still, pullback risks remain, as buyers need a daily close above the 98.00 figure so they can remain hopeful of testing last year’s high of 98.58. Once those levels are surpassed, the next stop would be the 99.00 figure.
For a bearish case, sellers need to drive prices below 97.00, through the Tenkan Sen at 96.97, toward the January 16 low of 96.58. A breach of the latter will expose the Kijun-Sen at 96.18, ahead of the Senkou Span B and A, each at 96.14 and 96.01.
AUD/JPY Price Action – Daily Chart
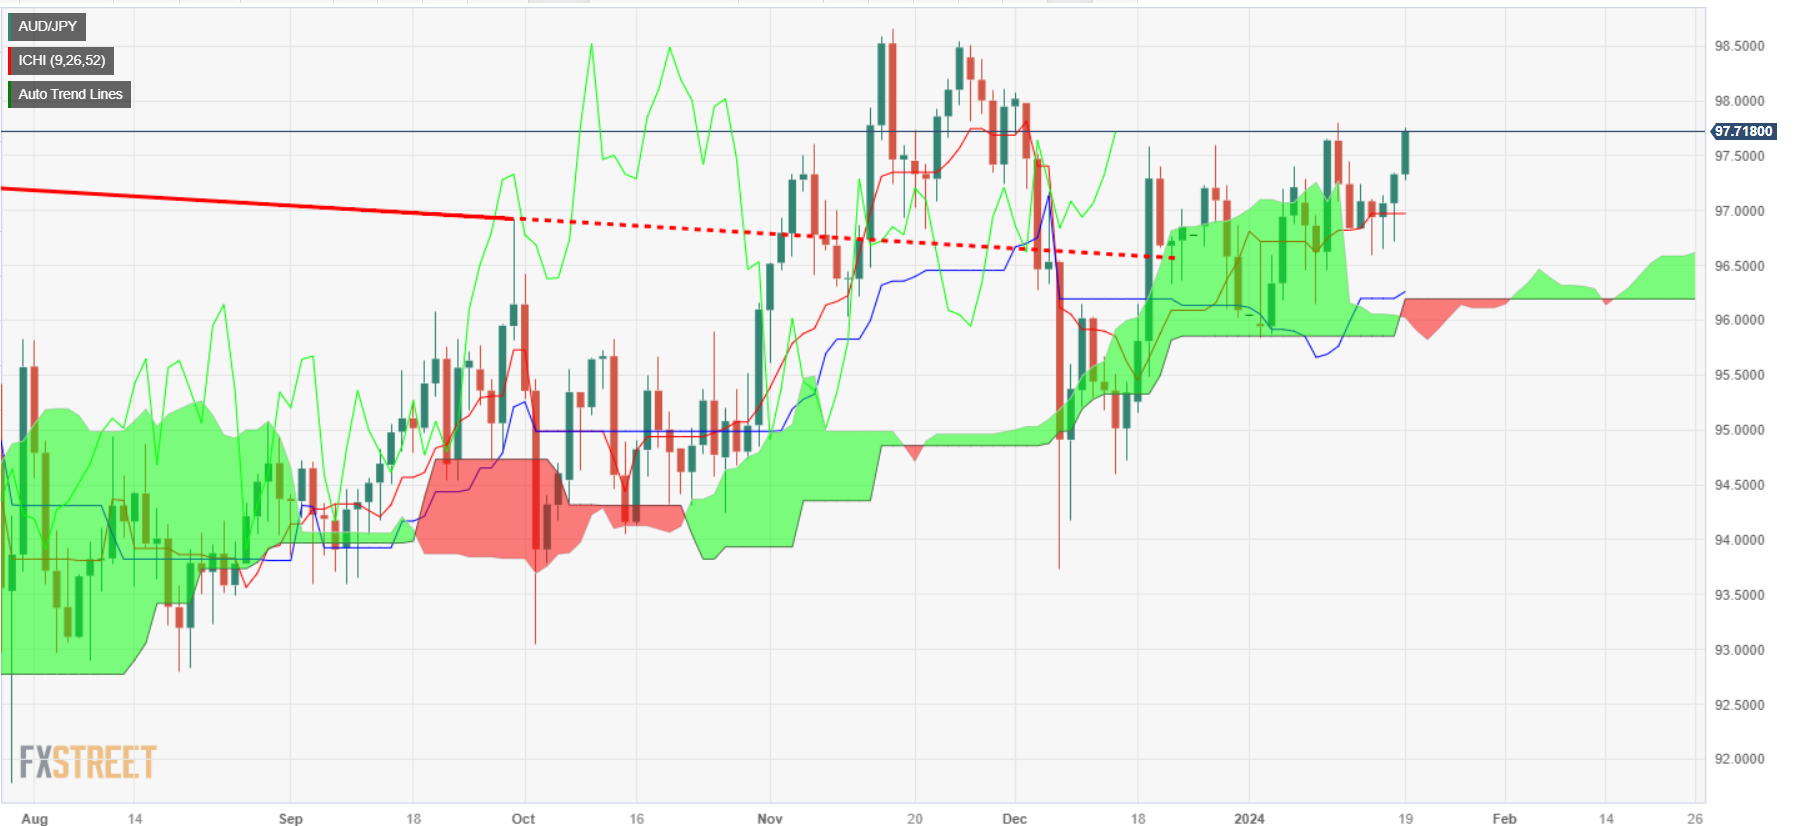
AUD/JPY Key Technical Levels
- European equity indexes saw slim losses on Friday to wrap up another down week.
- Davos wrapped up with little rate clues from policymakers.
- Rate tantrum is underway as investors pull back from overextended rate cut hopes.
European equity indexes declined on Friday as investors walked away from the World Economic Forum (WEF) in Davos, Switzerland with little upbeat headlines from the European Central Bank (ECB). ECB policymakers worked overtime this week talking down market expectations of impending rate cuts from the ECB. With inflation continuing to run hotter for longer in the European economy, the ECB is hamstrung on rate cuts for the time being.
ECB President Christine Lagarde put significant effort into avoiding discussing monetary policy durign her scheduled appearances during the Davos economic summit, but noted during a sideline interview with Bloomberg that overextended market expectations of rate cuts from the ECB may be hindering rather than helping on progress fighting inflation.
ECB Lagarde: Aggressive rate cut bets don't help ECB
With investors begrudgingly forced to push back their bets of ECB rate cuts after a lack of supporting statements from Davos, European equities pulled back on Friday. Most indexes saw their worst declines in several months this week, and bullish momentum continues to get hung up on misaligned market expectations.
The German DAX closed mostly flat on Friday, down a scant 0.07% and declining 12 points to close at €16,555.13. France’s CAC 40 declined nearly 40 points to close down 0.4% at €7,371.64. The pan-European STOXX600 closed at €469.24, down 0.26% and shedding 1.21 points.
London’s FTSE major equity index saw a scant gain on Friday, closing up 0.04% at £7,461.93, up 2.84 points but still tipping into a six-week low near £7,400.00.
DAX Technical Outlook
The German DAX tested a seven-week low this week, catching a late-week bid to wrap up trading near €16,550.00, still down on the week but keeping closing bids within reach of near-term lows.
The DAX is down for 2024, but remains decidedly higher from the last major low from October’s bottom bids near €14,600.00.
Intraday topside momentum got hamstrung by the 200-hour Simple Moving Average (SMA) near €16,600. Bidding action next week will face significant technical resistance from near-term congestion between €16,700.00 and €16,750.00.
DAX Hourly Chart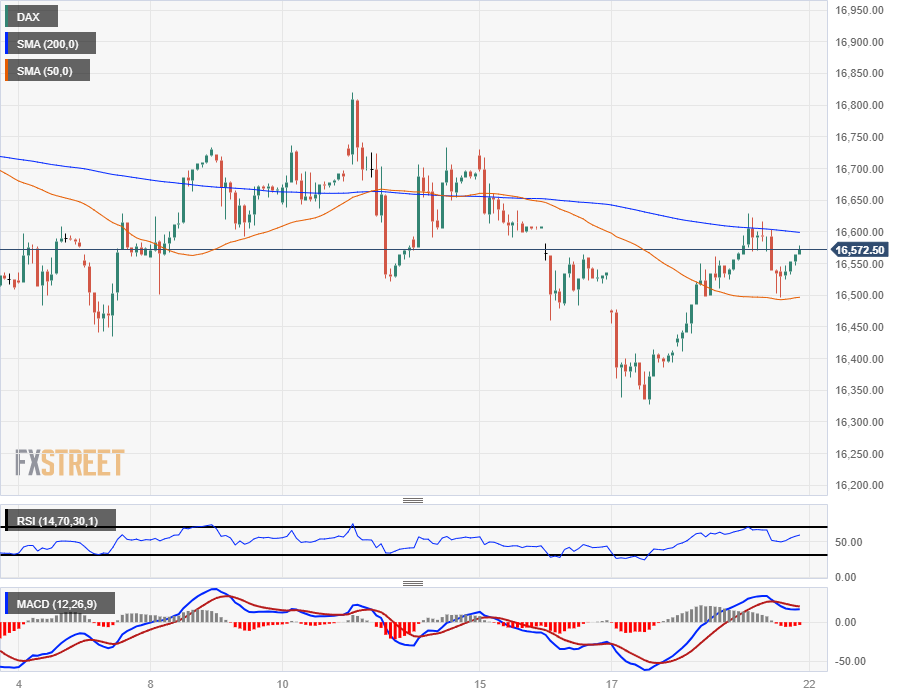
DAX Daily Chart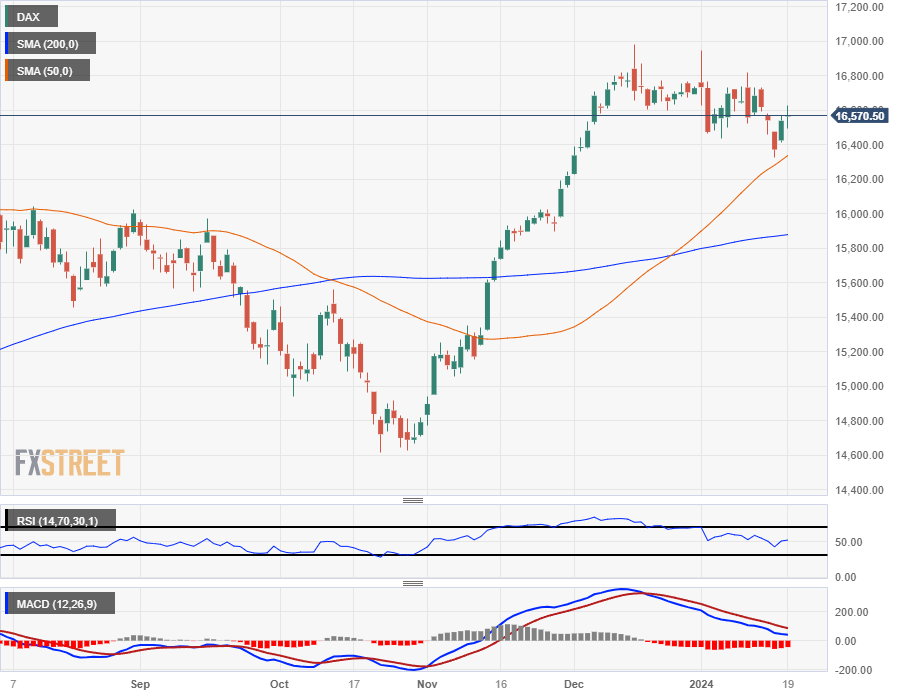
- The USD/JPY pair sees mild gains, settling at 148.25.
- No policy changes are expected at next week’s BoJ meeting; guidance will be looked upon.
- Despite bearish undertones in the four-hour-chart outlook, the pair's position above the 20,100,200-day SMAs indicates a broader bullish control.
On Friday's session, the USD/JPY was observed to be mildly gaining, currently trading at 148.25, and will close a 2% winning week. Dominating the daily chart, bullish sentiments prevail, with the bulls firmly holding their stance but seem to be taking a breather. Next week, the bulls might get further momentum if the Bank of Japan (BoJ) does not give additional clues on its monetary policy plans.
On the USD side, it remains resilient on the back of the US yields recovering and positive University of Michigan (UoM) Consumer Sentiment data, which gave the Greenback an additional boost. Next week, markets will eye December’s Personal Consumption Expenditures (PCE) figures from December, the Federal Reserve (Fed) preferred gauge of inflation to continue placing their bets on the next decision. The dovish expectations eased somewhat this week but are still high, and according to the CME FedWatch Tool, the odds of cuts in March and May stand at around 50% and 45%, respectively.
USD/JPY Technical Analysis
From a daily standpoint, the technical indicators reflect bullish strength, maintaining a firm position, but buyers are running out of steam. The Relative Strength Index (RSI) demonstrates a slight positive tilt within the positive region, while flat green bars of the Moving Average Convergence Divergence (MACD) further confirm a positive outlook but with a slight deceleration. Moreover, the placement of the pair distinctly above the 20, 100, and 200-day Simple Moving Averages (SMAs) indicates that the buying momentum overpowers any bearish undertones, giving the bulls an overall command.
USD/JPY daily chart
-638412895432125121.png)
- The CHF is broadly lower on the week, sending USD/CHF into a fresh six-week high.
- Switzerland Producer and Import Prices slipped further in December.
- SNB’S Jordan: appreciating Franc threatens Swiss inflation stability.
The Swiss Franc (CHF) slid further on Friday, extending recent losses as the market walks back a massive dogpile into the Swiss currency. The USD/CHF has climbed around 4.5% from December’s late low of 0.8332, a 12-year low for the pair.
Switzerland enjoys an economic environment massively different from its immediate European neighbors, with inflation already well within the Swiss National Bank’s (SNB) 2% maximum target and a stubbornly-healthy domestic economy.
The CHF gained significant value through 2023, climbing nearly 18% bottom-to-top against the US Dollar (USD) from 2022’s Q3 USD/CHF peak of 1.1047. With the popular CHF outrunning valuations and hampering the SNB’s ability to fine-tune policy using foreign currency reserves, the SNB flashed a warning to broader markets recently that if the CHF continues to appreciate, it will begin to transfer disinflationary pressure directly into the Swiss economy.
Having battled a disinflation cycle in the past, the SNB is in no rush to find itself mired in the same scenario again. Markets have apparently heeded SNB Chairman Thomas Jordan’s call for the time being, setting the USD/CHF on pace for its single-best weekly performance since late 2022.
USD/CHF Technical Outlook
The US Dollar is up around 1.85% against the Swiss Franc this week, climbing from Monday’s early bids near 0.8525, tapping the 0.8700 handle on Friday heading into the week’s closing bell.
The USD/CHF is set for its first technical challenge since finding the floor in late December, with the pair pushing directly into technical resistance from the 50-day Simple Moving Average (SMA) in the back half of the week’s trading.
A further technical ceiling is priced in at the 200-day SMA near 0.8850, with near-term technical barriers at the 0.880 handle where the pair last caught a swing high.
USD/CHF Hourly Chart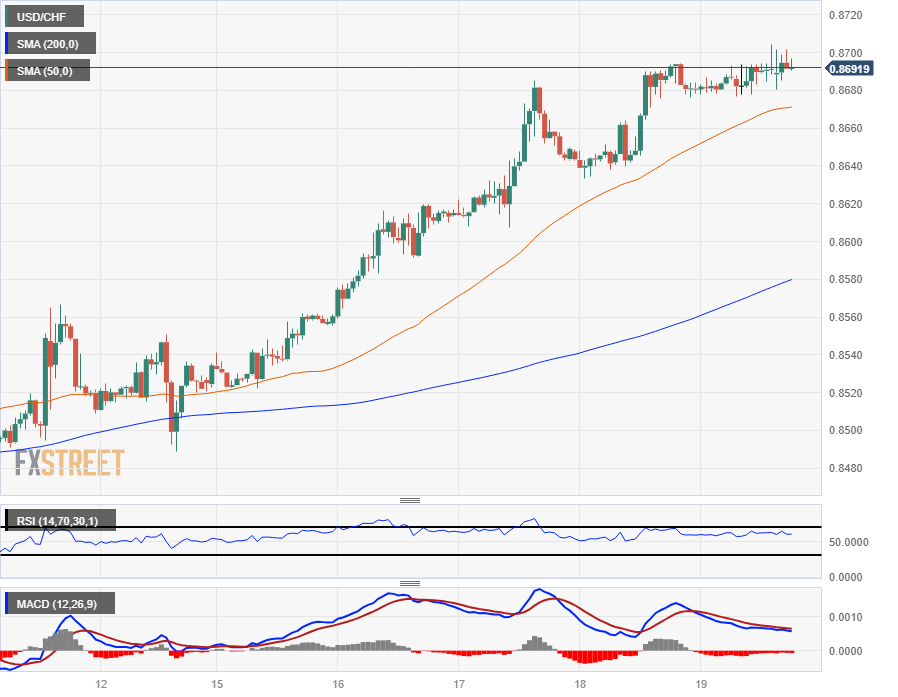
USD/CHF Daily Chart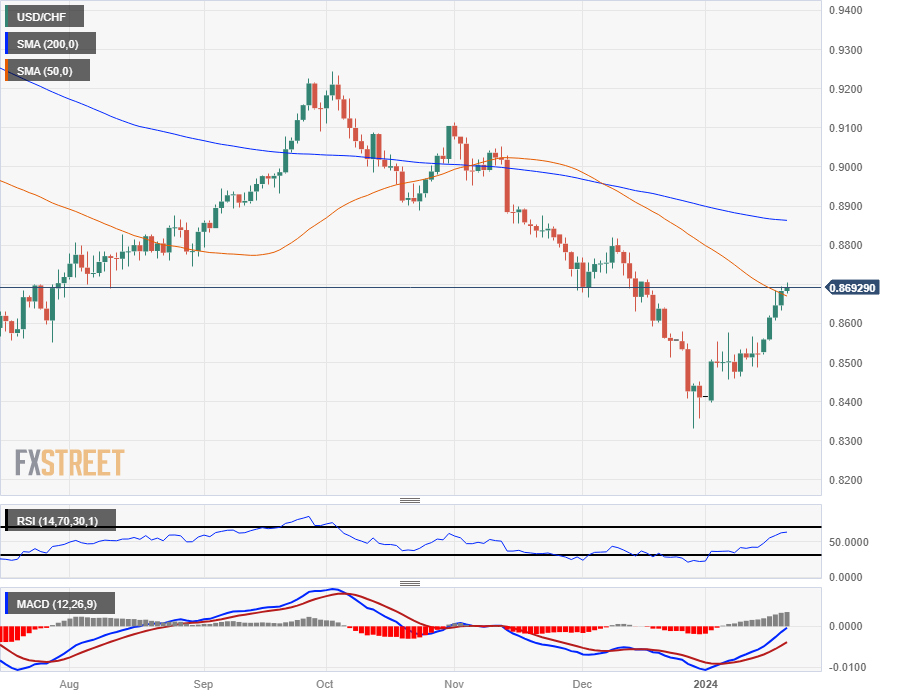
- Retail Sales Plunge: Pound Sterling drops against US Dollar as UK retail sales witness a staggering -3.2% month-over-month decline.
- BoE Policy Concerns: Bleak retail data raises doubts about Bank of England's policy tightening amid recession fears.
- Mixed US Data Influence: GBP/USD impacted by contrasting US data, with improved consumer sentiment but lower home sales.
The Pound Sterling (GBP) slumped against the US Dollar (USD) after the Office for National Statistics (ONS) revealed that retail sales plunged sharply, which could deter the Bank of England (BoE) from keeping policy tight without tapping the economy into a recession. Mixed data from the United States (US) sponsored a leg-down in the major, as the GBP/USD exchanged hands at 1.2687 after hitting a daily high of 1.2714.
Pound Sterling faces headwinds as poor retail data raises concerns, while mixed US indicators contribute to market volatility
Besides that, Chicago’s Federal Reserve (Fed) President Austan Goolsbee said that they (Fed) need more data before beginning to ease monetary policy to determine an appropriate level of restrictiveness. On the data front, Consumer Sentiment in the US improved sharply, according to a University of Michigan (UoM) poll, while inflation expectations were trimmed for one and five-year periods.
The Consumer Sentiment rose to 78.8, surpassing both forecasts and the previous month's increase of 69.7. Additionally, Americans expect a decrease in inflation, as expectations for one year declined from 3.1% to 2.9%, and for the next five years, it cooled from 2.9% to 2.8%.
US Existing Home Sales in December slid to their lowest level in over 13 years. The sales slumped by -1% month-over-month, falling from 3.82 million to 3.78 million, which is below both the previous month's figure and the forecast.
Across the pond, retail sales in the UK plunged a staggering -3.2% MoM, following an increase of 1.4% in November, and below forecasts for a 0.5% contraction. The release poured cold water on Sterling’s rally, which benefited from a red-hot inflation report, which, according to sources cited by Reuters, “the December CPI surprise was a blip.”
Ahead of the day, the San Franciso Fed President Mary Daly is expected to cross wires ahead of the blackout period, which is ahead of the first monetary policy meeting of 2024.
GBP/USD Price Analysis: Technical outlook
From a technical point of view, GBP/USD is trading sideways but tilted to the downside after peaking at around 1.2785 on January 12, but sellers had failed to crack the 50-day moving average (DMA) at 1.2616. if buyers want the rally to continue, they must drag prices bove 1.2700, followed by 1.2785, ahead of the 1.2800 mark. Conversely, if sellers achieve a daily close below January’s 18 open of 1.2676, that would form a ‘tweezers top,’ opening the door for further losses. First support is seen at the 50-DMA at 1.2616, followed by 1.2600 and the 200-DMA at 1.2547.
- The DXY Index trades just below the 200-day SMA as bulls are struggling to hold their ground.
- Existing Home Sales from December were weak, while the University of Michigan Consumer Sentiment arrived better than expected.
- Dovish bets on the Fed remain high.
The US Dollar (USD) is seen neutral by the end of the week and currently tallies a 0.90% weekly gain. Strong University of Michigan (UoM) data is keeping the USD afloat, but steady dovish bets on the Federal Reserve (Fed) limit the upward potential.
The US economy appears overheated, tempering the market's dovish expectations, although the chances of interest rate cuts in March and May lingers at around 50%. Thus, the US dollar remains in fluctuating currents, affected by both resilient economic performance and dovish bets on the Fed's likely moves.
Daily digest market movers: US Dollar stands neutral as markets asses UoM and Housing data
- The Michigan Consumer Expectations for January reported by the University of Michigan (UoM) came in at 75.9, an increase from the December figure of 67.4.
- The five-year Inflation Expectations saw a slight decrease of 2.8% compared to the previous month's 2.9%.
- Similarly, the UoM’s Inflation Expectations for January were down to 2.9% from the previous 3.1%.
- The Current Conditions for January increased to 83.3 compared to December's 73.3.
- December’s Existing Home Sales from the National Association of Realtors (NAR) turned out lower than expected at 3.78M against the anticipated 3.82M.
- The yields for US bonds are still advancing with the 2-year yield at 4.41%, the 5-year yield at 4.09%, and the 10-year yield at 4.17%. All three are at their highest level since mid-December.
- As per the CME FedWatch Tool, the odds of cuts for March and May eased, but they remain high at 55% and 45%, respectively.
Technical Analysis: DXY Index bulls shows resilience, must recover the 200-day average
The Relative Strength Index (RSI) showcases an upward slope, residing well within positive territory, which generally denotes bullish strength. This is concurrent with the Moving Average Convergence Divergence (MACD), which, propelled by the rising green bars, indicates strong buying momentum. However, those indicators are starting to flatten as the index tallied a five-day winning streak.
Reflecting upon the Simple Moving Averages (SMAs), the index holds a position above the 20-day average, denoting an undercurrent of bullish dominance in the immediate short term. However, if the bulls fail to regain the 200-day SMA, more downside may be on the horizon.
Support levels: 103.20, 103.00, 102.80.
Resistance levels 103.40 (200-day SMA), 103.60, 103.80.
US Dollar FAQs
What is the US Dollar?
The US Dollar (USD) is the official currency of the United States of America, and the ‘de facto’ currency of a significant number of other countries where it is found in circulation alongside local notes. It is the most heavily traded currency in the world, accounting for over 88% of all global foreign exchange turnover, or an average of $6.6 trillion in transactions per day, according to data from 2022.
Following the second world war, the USD took over from the British Pound as the world’s reserve currency. For most of its history, the US Dollar was backed by Gold, until the Bretton Woods Agreement in 1971 when the Gold Standard went away.
How do the decisions of the Federal Reserve impact the US Dollar?
The most important single factor impacting on the value of the US Dollar is monetary policy, which is shaped by the Federal Reserve (Fed). The Fed has two mandates: to achieve price stability (control inflation) and foster full employment. Its primary tool to achieve these two goals is by adjusting interest rates.
When prices are rising too quickly and inflation is above the Fed’s 2% target, the Fed will raise rates, which helps the USD value. When inflation falls below 2% or the Unemployment Rate is too high, the Fed may lower interest rates, which weighs on the Greenback.
What is Quantitative Easing and how does it influence the US Dollar?
In extreme situations, the Federal Reserve can also print more Dollars and enact quantitative easing (QE). QE is the process by which the Fed substantially increases the flow of credit in a stuck financial system.
It is a non-standard policy measure used when credit has dried up because banks will not lend to each other (out of the fear of counterparty default). It is a last resort when simply lowering interest rates is unlikely to achieve the necessary result. It was the Fed’s weapon of choice to combat the credit crunch that occurred during the Great Financial Crisis in 2008. It involves the Fed printing more Dollars and using them to buy US government bonds predominantly from financial institutions. QE usually leads to a weaker US Dollar.
What is Quantitative Tightening and how does it influence the US Dollar?
Quantitative tightening (QT) is the reverse process whereby the Federal Reserve stops buying bonds from financial institutions and does not reinvest the principal from the bonds it holds maturing in new purchases. It is usually positive for the US Dollar.
Atlanta Federal Reserve (Fed) President Raphael Bostic is crossing the newswires on Friday, reaffirming his stance on rate cut expectations ahead of the Fed entering the "blackout" period before the US central bank's next rate meeting, slated for January 31.
Key highlights
- Atlanta Fed President Bostic: I am open to changing my outlook on the timing of rate cuts.
- Fed remains data-dependent, Bostic will only change position if inflation numbers change.
- Fed's Bostic needs to see inflation well on the way to 2% before actively advocating for rate cuts.
- The Euro saw slim to moderate gains on Friday ahead of ECB blackout.
- Europe got a reprieve from high-impact economic data this week.
- Next week sees euro area’s latest HCOB PMIs, as well the ECB’s next rate call.
The Euro (EUR) stepped broadly higher on Friday as market sentiment recovered its footing in the last day of trading for the week.
Europe got a break from the economic calendar this past week with most markets focused on headlines from the World Economic Forum (WEF) in Davos, Switzerland. European Central Bank (ECB) policymakers have been running a media circuit in an effort to talk down market expectations of rate cuts from the ECB, and ECB President Christine Lagarde put significant effort into specifically not addressing monetary policy during a slew of scheduled appearances at the WEF.
Daily digest market movers: Euro catches a thin rebound on Friday
- ECB President Lagarde wrapped up the last of her three scheduled appearances at Davos without specifically addressing monetary policy.
- ECB officials have hit the newswires in a steady stream this week, cautioning that market expectations of rate cuts have run well ahead of what the ECB is willing to execute.
- ECB President Lagarde warned that too-optimistic markets will hamper rather than help in the fight with inflation.
- ECB could cut by the summer, but only if new inflationary pressures don’t appear.
- ECB’s Lagarde on Davos sidelines: Aggressive rate cut bets don't help ECB
- A lack of economic data for the euro area this week gave Euro traders a reprieve from headline shock.
- The ECB has entered the “blackout” period ahead of next Thursday’s ECB policy meeting and rate call.
- Euro area Purchasing Managers’ Index figures due next Wednesday, markets forecast a slight uptick in HCOB Composite PMI for January from 47.6 to 48.1.
- Coming up next week: It is central banks’ time
Euro price today
The table below shows the percentage change of Euro (EUR) against listed major currencies today. Euro was the strongest against the Pound Sterling.
| USD | EUR | GBP | CAD | AUD | JPY | NZD | CHF | |
| USD | -0.11% | 0.23% | -0.18% | -0.12% | -0.05% | 0.17% | 0.13% | |
| EUR | 0.11% | 0.33% | -0.07% | -0.02% | 0.06% | 0.27% | 0.24% | |
| GBP | -0.23% | -0.33% | -0.40% | -0.37% | -0.28% | -0.06% | -0.07% | |
| CAD | 0.18% | 0.05% | 0.39% | 0.02% | 0.11% | 0.33% | 0.32% | |
| AUD | 0.14% | 0.06% | 0.40% | -0.04% | 0.09% | 0.30% | 0.27% | |
| JPY | 0.05% | -0.05% | 0.29% | -0.11% | -0.08% | 0.23% | 0.20% | |
| NZD | -0.16% | -0.27% | 0.06% | -0.33% | -0.30% | -0.21% | -0.01% | |
| CHF | -0.16% | -0.23% | 0.06% | -0.33% | -0.29% | -0.18% | 0.00% |
The heat map shows percentage changes of major currencies against each other. The base currency is picked from the left column, while the quote currency is picked from the top row. For example, if you pick the Euro from the left column and move along the horizontal line to the Japanese Yen, the percentage change displayed in the box will represent EUR (base)/JPY (quote).
Technical Analysis: Euro sees an uptick on Friday but little momentum against the Greenback
The Euro (EUR) rebounds softly on Friday and is in the green across the major currency board except for thin mileage against the US Dollar (USD) and the Canadian Dollar (CAD). The Euro is up around a third of a percent against the Pound Sterling (GBP) and the Australian Dollar (AUD), and about a quarter of a percent higher versus the Swiss Franc (CHF).
The EUR/USD sees limp trading with the pair caught in near-term congestion between major moving averages. Intraday action on Friday has been mostly flat as the pair sees a thin rebound from midweek declines into 1.0850, and the near-term price ceiling is drawn in from 1.0900.
Daily candlesticks are trapped between the 50-day and 200-day Simple Moving Averages (SMA) at 1.0920 and 1.0850, respectively. The pair remains in technically bullish territory with a higher-lows pattern etched in from September’s lows near 1.0450. Price action sees a technical ceiling at January’s soft barrier at the 1.1000 handle.
EUR/USD Hourly Chart
EUR/USD Daily Chart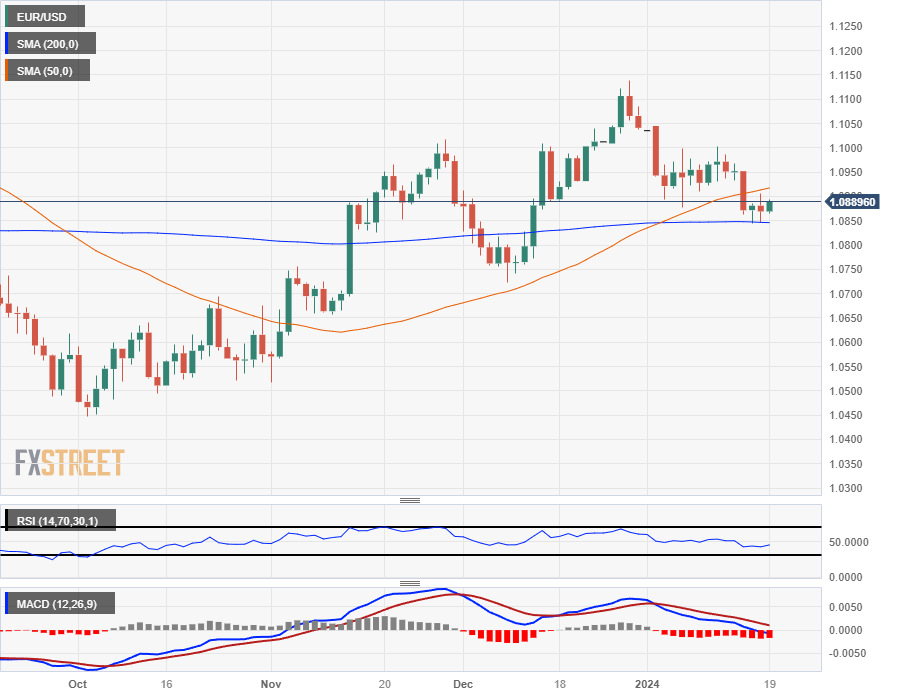
Euro FAQs
What is the Euro?
The Euro is the currency for the 20 European Union countries that belong to the Eurozone. It is the second most heavily traded currency in the world behind the US Dollar. In 2022, it accounted for 31% of all foreign exchange transactions, with an average daily turnover of over $2.2 trillion a day.
EUR/USD is the most heavily traded currency pair in the world, accounting for an estimated 30% off all transactions, followed by EUR/JPY (4%), EUR/GBP (3%) and EUR/AUD (2%).
What is the ECB and how does it impact the Euro?
The European Central Bank (ECB) in Frankfurt, Germany, is the reserve bank for the Eurozone. The ECB sets interest rates and manages monetary policy.
The ECB’s primary mandate is to maintain price stability, which means either controlling inflation or stimulating growth. Its primary tool is the raising or lowering of interest rates. Relatively high interest rates – or the expectation of higher rates – will usually benefit the Euro and vice versa.
The ECB Governing Council makes monetary policy decisions at meetings held eight times a year. Decisions are made by heads of the Eurozone national banks and six permanent members, including the President of the ECB, Christine Lagarde.
How does inflation data impact the value of the Euro?
Eurozone inflation data, measured by the Harmonized Index of Consumer Prices (HICP), is an important econometric for the Euro. If inflation rises more than expected, especially if above the ECB’s 2% target, it obliges the ECB to raise interest rates to bring it back under control.
Relatively high interest rates compared to its counterparts will usually benefit the Euro, as it makes the region more attractive as a place for global investors to park their money.
How does economic data influence the value of the Euro?
Data releases gauge the health of the economy and can impact on the Euro. Indicators such as GDP, Manufacturing and Services PMIs, employment, and consumer sentiment surveys can all influence the direction of the single currency.
A strong economy is good for the Euro. Not only does it attract more foreign investment but it may encourage the ECB to put up interest rates, which will directly strengthen the Euro. Otherwise, if economic data is weak, the Euro is likely to fall.
Economic data for the four largest economies in the euro area (Germany, France, Italy and Spain) are especially significant, as they account for 75% of the Eurozone’s economy.
How does the Trade Balance impact the Euro?
Another significant data release for the Euro is the Trade Balance. This indicator measures the difference between what a country earns from its exports and what it spends on imports over a given period.
If a country produces highly sought after exports then its currency will gain in value purely from the extra demand created from foreign buyers seeking to purchase these goods. Therefore, a positive net Trade Balance strengthens a currency and vice versa for a negative balance.
While Fed and ECB officials pushed back expectations of interest rate cuts for later than anticipated amidst strong data and the rebound in inflation, the upcoming week is also expected to maintain the centre of the debate around central banks. In addition, key data is expected in the US as well as preliminary PMIs on both sides of the ocean.
On the US calendar, flash Manufacturing and Services PMIs for the month of January are due on January 24 ahead of a slew of data releases on January 25: Durable Goods Orders, another revision of the Q4 GDP Growth Rate, weekly Initial Claims, the Chicago Fed National Activity Index, and New Home Sales. Closing the week comes another version of inflation, this time tracked by the PCE along with Personal Income, Personal Spending, and Pending Home Sales. Stronger-than-estimated results from key fundamentals and their impact on the Fed rate cut bets were the main drivers of the USD Index (DXY) during the past week. In light of those upcoming releases, the so-far 2024 peak around 103.70 could be challenged.
In the euro docket, the European Commission will publish its preliminary print of Consumer Confidence for the current month on January 23. Advanced January PMIs are also due in Germany and the broader Euroland on January 25. On January 26, the IFO institute will publish its Business Climate gauge in Germany, while GfK will measure its Consumer Confidence for the month of February. In the meantime, EUR/USD seems to have met some contention around 1.0840, a region also reinforced by the 200-day SMA.
In Japan, December Balance of Trade figures are due along with flash PMIs (January 24) and the BoJ Minutes on January 26. USD/JPY maintained the bullish view intact this week, advancing to seven-week tops in levels shy of the 149.00 barrier.
Across the Channel, the Public Sector finances take centre stage on January 23, followed by preliminary PMIs (January 24) and Gfk’s Consumer Confidence on January 26. GBP/USD closed the week with modest losses, although it maintained the yearly consolidation between 1.2600 and 1.2800.
Flash PMIs will take centre stage in Australia (January 23), ahead of the Westpac Leading Index (January 24). Australian markets will be closed on January 26 in observance of the Australia Day holiday. AUD/USD extended its pessimistic start of the year for yet another week, although the decent bounce in the latter part of the week allows for some near-term recovery.
In the central bank's galaxy, the PBoC is seen trimming its 1-Year LPR and 5-Year LPR by 10 bps to 3.35% and 4.10%, respectively (January 21). No surprises are expected from the BoJ at its event on January 23, nor from the BoC and the BNM when they meet on January 24. On January 25, a 25 bps rate hike is not ruled out by the Norges Bank, while the ECB is widely anticipated to keep rates unchanged and uncertain remains around the interest rate decision by the CBRT.
- Silver holds ground at $22.50, resilient amid losses, finding strong support at this key level.
- US Consumer Sentiment boost lifts US Treasury yields, affecting XAG/USD dynamics.
- Mixed economic signals: Wall Street gains, but US Existing Home Sales hit 13-year low; improved inflation outlook.
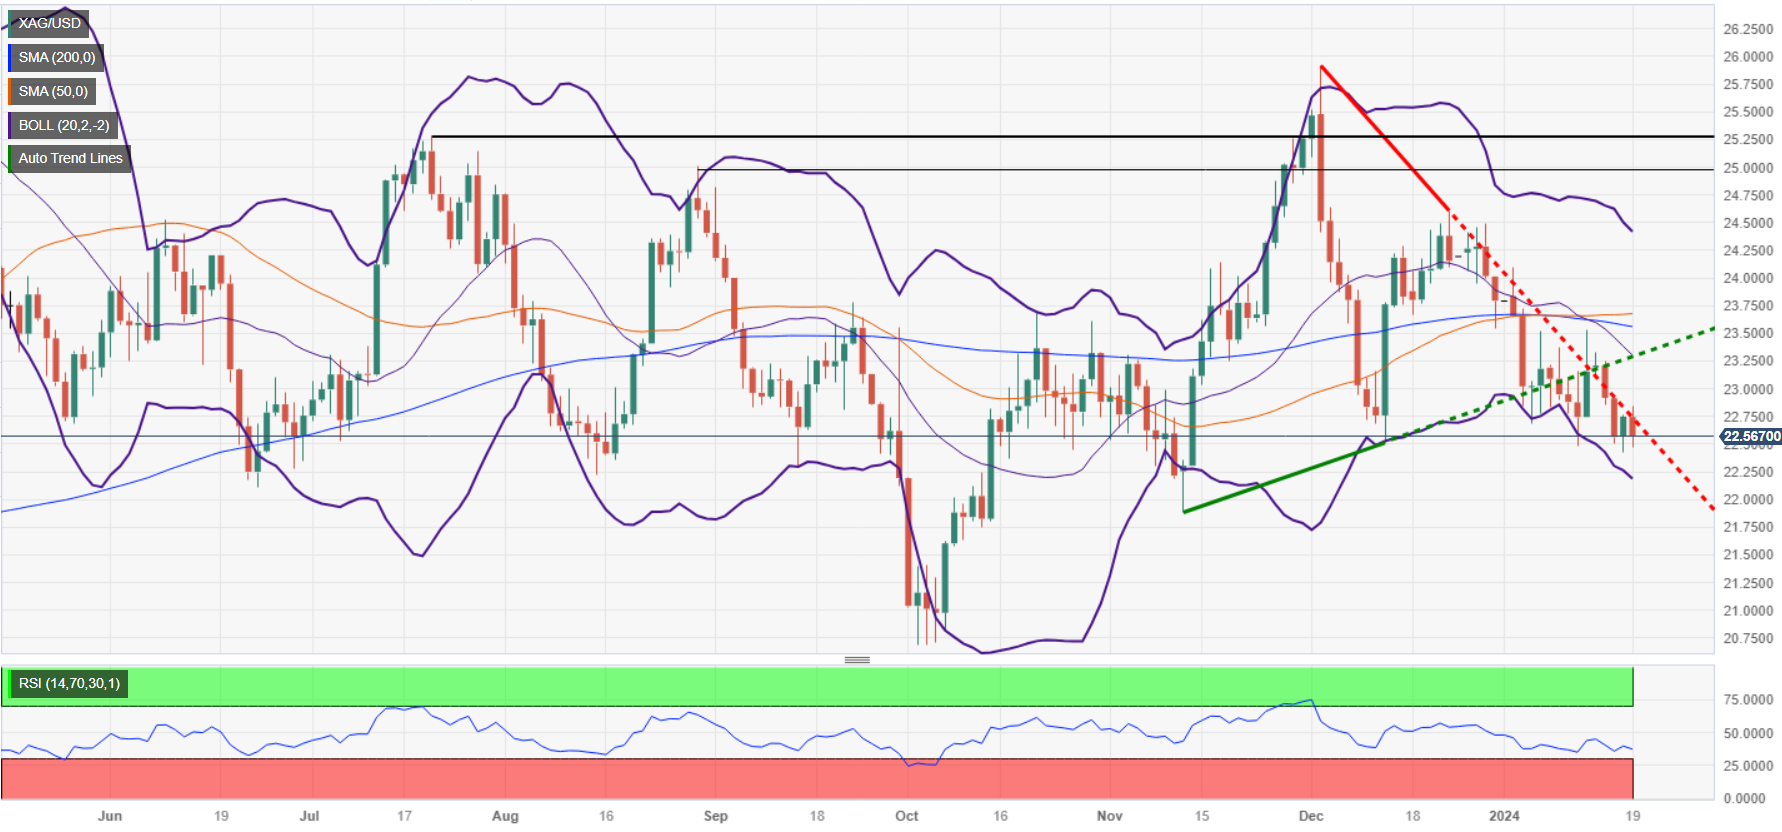
Silver price is extending its losses for the third time in the week and faces solid support at around familiar levels, with sellers unable to decisively push prices below the $22.50 figure. Sentiment improvement amongst US consumers spurred a jump in US Treasury yields. At the time of writing, the XAG/USD trades at $22.50, down 0.99%.
XAG/USD holds ground at $22.50 despite Treasury yields surge
Wall Street trades solidly in the green while US Treasury bond yields advance. Despite that, the US Dollar Index (DXY), which measures the buck’s value against a basket of six currencies, is virtually unchanged at 103.41.
Data-wise, US Existing Home Sales fell to their lowest level over 13 years, slumping -1 % MoM to 3.78 million from 3.82 million the previous months and forecasts. At the same time, US households became more optimistic about the economic and inflation outlook, revealed the University of Michigan (UoM): The UoM Consumer Sentiment on its preliminary reading for January rose by 78.8, exceeding forecasts and last month’s 69.7 increase. Moreover, Americans expect inflation to tick lower in 12 months from now, from 3.1% to 2.9%, and for five years, cooled from 2.9% to 2.8%.
Following the data, the US 10-year Treasury note yield soared toward 4.196% before stabilizing at around 4.163%, a headwind for precious metals, which usually benefit from lower yields.
In the meantime, Chicago’s Fed President Austan Goolsbee said they need more data before cutting rates to determine the level of restrictiveness.
Ahead of the day, the San Franciso Fed President Mary Daly is expected to cross wires ahead of the blackout period, which is ahead of the first monetary policy meeting of 2024.
XAG/USD Price Analysis: Technical outlook
From a technical standpoint, Silver has consolidated above/below the $22.50 area, which, once decisively broken to the downside, should expose the next support level seen at the November 13 cycle low of $21.88. Further losses are seen, once surpassed with the next swing at at$20.69, the October 3 low. On the other hand, if buyers lift XAG/USD above the $23.00 figure, that would expose key resistance levels seen at $23.17, the 100-day moving average (DMA), followed by the 200 and 50-DMAs, each at $23.54 and $23.66, respectively.
- Canadian Dollar softly up on Friday as Crude Oil rises.
- Canada Retail Sales decline more than expected, hampers topside.
- Loonie up overall on the week but still down against the US Dollar.
The Canadian Dollar (CAD) rose on Friday, bolstered by a late-week climb in Crude Oil bids as CAD traders shrugged off headwinds for the time being.
Canada saw Retail Sales decline at a faster pace than expected in November, and the Bank of Canada (BoC) was added to the growing list of global central banks that are expected to deliver rate cuts at a slower and shallower pace than investors initially hoped for.
Daily digest market movers: Canadian Dollar sheds overhang in headlines to rebound on Friday
- Canadian Retail Sales declined 0.2% in November, missing the forecast hold at 0.0% and declining further from October’s 0.7%.
- Core Retail Sales accelerated declines, printing at -0.5% versus the anticipated -0.1% and the previous 0.4% (revised down from 0.6%).
- Canada Employment Insurance Beneficiaries Change rose to 1.7% in November versus the previous 0.7%.
- US Consumer Inflation Expectations declined in January from 2.9% to 2.8%, according to the University of Michigan’s (UoM) consumer survey.
- UoM’s Consumer Sentiment Index also improved in January, rising from 69.7 to 78.8 compared to the forecast 70.0.
- US Existing Home Sales declined 1% in December, swallowing November’s 0.8% uptick.
- According to surveyed economists, the Bank of Canada is expected to start cutting interest rates much later than previously anticipated, with the majority seeing no rate changes until June at the earliest.
- Overall rate cuts are expected to be much shallower than investors initially hoped.
- Bottomless Crude Oil demand from US refineries as well as a cold snap trimming production rates see US reserves declining, bumping Crude Oil bids heading into the weekend.
Canadian Dollar price today
The table below shows the percentage change of Canadian Dollar (CAD) against listed major currencies today. Canadian Dollar was the strongest against the New Zealand Dollar.
| USD | EUR | GBP | CAD | AUD | JPY | NZD | CHF | |
| USD | -0.07% | 0.27% | -0.14% | -0.01% | 0.02% | 0.29% | 0.10% | |
| EUR | 0.06% | 0.32% | -0.08% | 0.04% | 0.08% | 0.35% | 0.16% | |
| GBP | -0.27% | -0.36% | -0.44% | -0.30% | -0.26% | 0.02% | -0.17% | |
| CAD | 0.14% | 0.08% | 0.43% | 0.13% | 0.17% | 0.45% | 0.26% | |
| AUD | 0.00% | -0.05% | 0.29% | -0.14% | 0.01% | 0.28% | 0.09% | |
| JPY | -0.01% | -0.11% | 0.26% | -0.18% | -0.04% | 0.27% | 0.09% | |
| NZD | -0.28% | -0.38% | -0.01% | -0.46% | -0.32% | -0.28% | -0.19% | |
| CHF | -0.11% | -0.16% | 0.17% | -0.26% | -0.14% | -0.06% | 0.19% |
The heat map shows percentage changes of major currencies against each other. The base currency is picked from the left column, while the quote currency is picked from the top row. For example, if you pick the Euro from the left column and move along the horizontal line to the Japanese Yen, the percentage change displayed in the box will represent EUR (base)/JPY (quote).
Technical Analysis: Canadian Dollar climbs across the board on Friday, USD/CAD sheds 1.3500
The Canadian Dollar (CAD) is in the green against all of its major currency peers on Friday, gaining around four-tenths of a percent against the Pound Sterling (GBP) and the New Zealand Kiwi (NZD), with the smallest gains of around a tenth of a percent against the Euro (EUR) and the Australian Dollar (AUD).
The US Dollar is down about a fifth of a percent against the Canadian Dollar on Friday after an intraday rejection from the 1.3500 level before testing into the 1.3450 region. Near-term momentum is seeing the USD/CAD drift back toward the 200-day Simple Moving Average (SMA) near 1.3430.
Daily candlesticks are getting hung up on the 200-day SMA just below the 1.3500 level, and the USD/CAD could see a technical rejection extend into a bearish pullback with a price floor chalked in near 1.3200.
Even if buyers find the topside momentum necessary to carry the USD/CAD over the consolidation of the 50-day and 200-day SMAs near 1.3500, there’s still a lot of ground to cover before bids can recover the last swing high set in early November near 1.3900.
USD/CAD Hourly Chart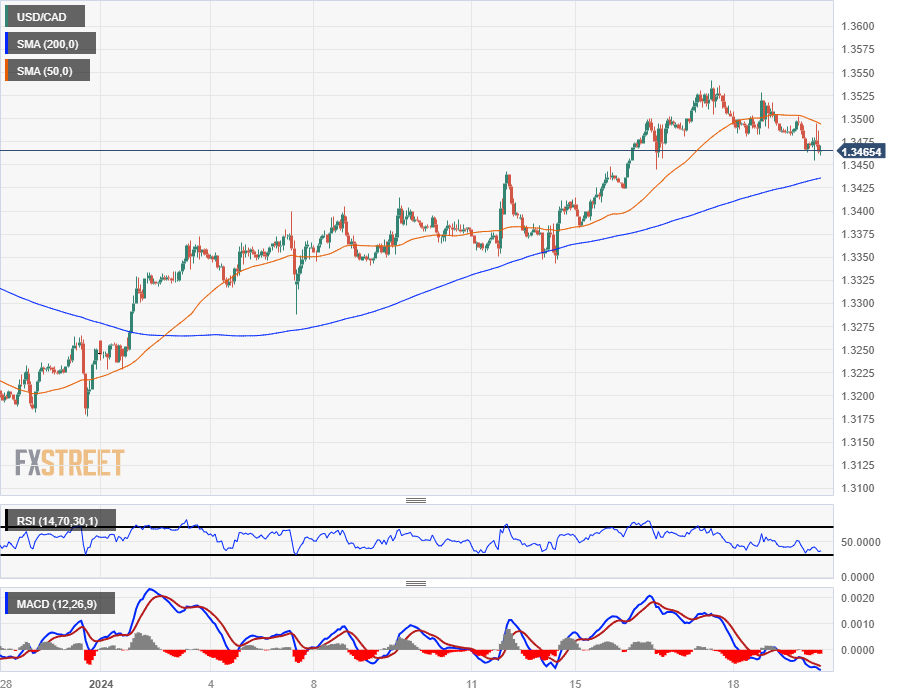
USD/CAD Daily Chart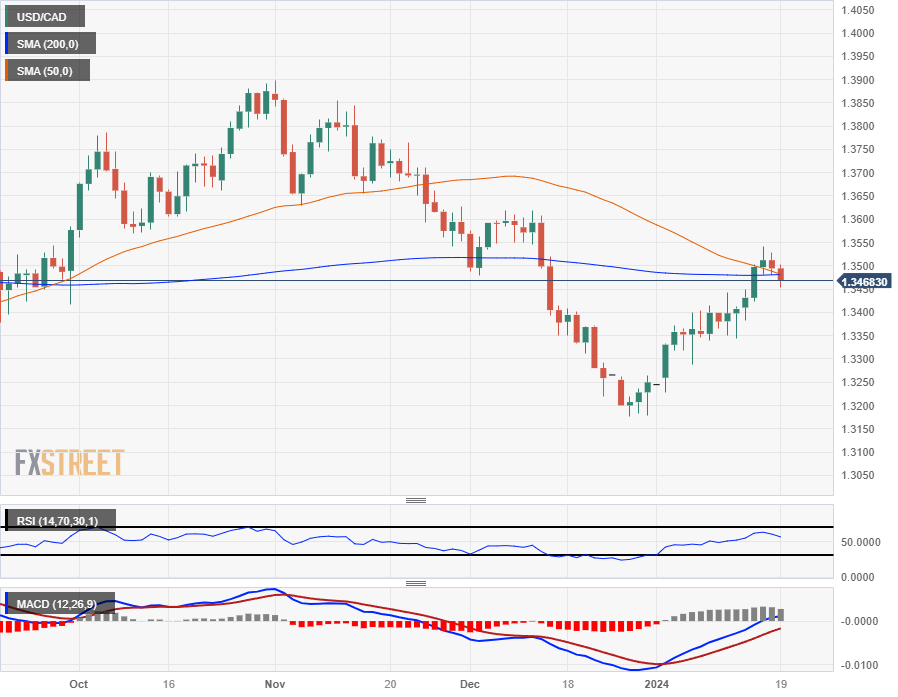
Canadian Dollar FAQs
What key factors drive the Canadian Dollar?
The key factors driving the Canadian Dollar (CAD) are the level of interest rates set by the Bank of Canada (BoC), the price of Oil, Canada’s largest export, the health of its economy, inflation and the Trade Balance, which is the difference between the value of Canada’s exports versus its imports. Other factors include market sentiment – whether investors are taking on more risky assets (risk-on) or seeking safe-havens (risk-off) – with risk-on being CAD-positive. As its largest trading partner, the health of the US economy is also a key factor influencing the Canadian Dollar.
How do the decisions of the Bank of Canada impact the Canadian Dollar?
The Bank of Canada (BoC) has a significant influence on the Canadian Dollar by setting the level of interest rates that banks can lend to one another. This influences the level of interest rates for everyone. The main goal of the BoC is to maintain inflation at 1-3% by adjusting interest rates up or down. Relatively higher interest rates tend to be positive for the CAD. The Bank of Canada can also use quantitative easing and tightening to influence credit conditions, with the former CAD-negative and the latter CAD-positive.
How does the price of Oil impact the Canadian Dollar?
The price of Oil is a key factor impacting the value of the Canadian Dollar. Petroleum is Canada’s biggest export, so Oil price tends to have an immediate impact on the CAD value. Generally, if Oil price rises CAD also goes up, as aggregate demand for the currency increases. The opposite is the case if the price of Oil falls. Higher Oil prices also tend to result in a greater likelihood of a positive Trade Balance, which is also supportive of the CAD.
How does inflation data impact the value of the Canadian Dollar?
While inflation had always traditionally been thought of as a negative factor for a currency since it lowers the value of money, the opposite has actually been the case in modern times with the relaxation of cross-border capital controls. Higher inflation tends to lead central banks to put up interest rates which attracts more capital inflows from global investors seeking a lucrative place to keep their money. This increases demand for the local currency, which in Canada’s case is the Canadian Dollar.
How does economic data influence the value of the Canadian Dollar?
Macroeconomic data releases gauge the health of the economy and can have an impact on the Canadian Dollar. Indicators such as GDP, Manufacturing and Services PMIs, employment, and consumer sentiment surveys can all influence the direction of the CAD. A strong economy is good for the Canadian Dollar. Not only does it attract more foreign investment but it may encourage the Bank of Canada to put up interest rates, leading to a stronger currency. If economic data is weak, however, the CAD is likely to fall.
- Mexican Peso appreciates more than 0.15%, overcoming weak Retail Sales data and sluggish economic growth projections.
- Former Banxico Deputy Governor Elizondo suggests a continued tight monetary policy stance in Mexico.
- Improved US Consumer Sentiment and revised inflation expectations likely capped the Peso’s advance.
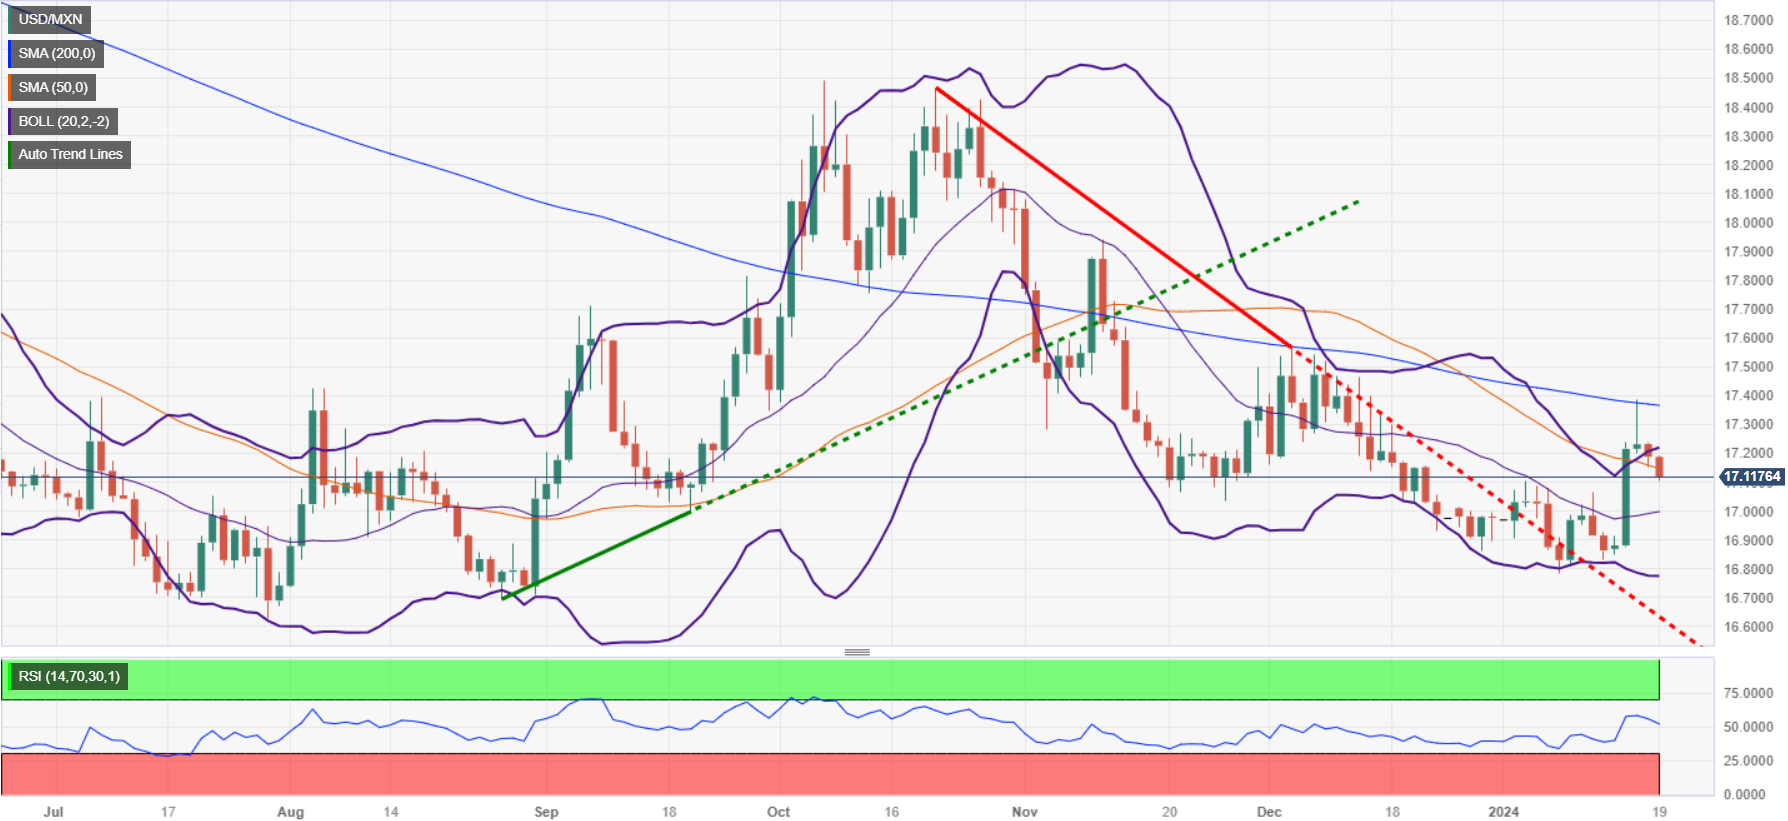
The Mexican Peso (MXN) registered solid gains against the US Dollar (USD), but it remains set to register losses of more than 1.45% in the week after Retail Sales in the country missed estimates, growing less than expected. In addition, the National Statistics Agency (INEGI) revealed that Mexico’s economy would likely grow below the 3% expected by analysts in December in a preliminary reading by the Timely Indicator of Economic Activity (IOAE). Nevertheless, the USD/MXN exchanges hands at 17.11, down by 0.29%, favoring the emerging market currency.
In the meantime, former Bank of Mexico (Banxico) Deputy Governor Everardo Elizondo commented that it’s too soon to relax monetary policy in Mexico, adding, “There are enough reasons to remain worried.” Elizondo added, "if [policy] is loosened, inflationary expectations will deteriorate.”
Across the border, Consumer Sentiment improved, according to a University of Michigan poll, and households downwardly revised inflation expectations for one and five-year periods.
Daily digest market movers: Mexican Peso regains control amid mixed Mexico data
- Mexico’s Retail Sales rose by a minimum of 0.1% MoM, below forecasts of 0.5% and trailing October’s 0.7%. Annually the indicator slowed from 3.4% to 2.7%, lower than estimates of 3.2%.
- Mexico’s INEGI revealed that the Timely Indicator of Economic Activity (IOAE) anticipates economic growth of 2.6% in December.
- The preliminary reading from the Michigan Consumer Sentiment Index reached its highest level since the summer of 2021 and came in at 78.8, exceeding forecasts of 70 and the previous reading of 69.7. Joanne Hsu, the Director of Surveys of Consumer, said, “Consumer views were supported by confidence that inflation has turned a corner and strengthening income expectations.”
- US households’ inflation expectations for one year dropped from 3.1% to 2.9% and from 2.9% to 2.8% for five years.
- Existing Home Sales fell in December as supply showed signs of improvement, according to the National Association of Realtors. Sales rose by 3.78 million, below estimates of 3.82 million and trailed November’s 0.8% increase.
- The US economy remains robust, as most data suggests the economy continues to expand at a steady pace. The Atlanta GDPNow model suggests last year’s Q4 would likely expand by 2.4%, spurred by strong retail sales, firm industrial production, a tight labor market and consumer sentiment improvement.
- Following the release of the Michigan survey of consumer sentiment, investors continued to trim bets on rate cuts by the Federal Reserve. At the beginning of the week, the swaps market priced in 175 basis points of rate cuts in 2024. But following solid US data this week, those were trimmed to 150 bps.
- The strongest catalyst in the week has been Federal Reserve Governor Christopher Waller’s speech: “No reason to move as quickly or cut as rapidly as in the past.” This kept investors in check despite supporting rate cuts if inflation indeed gets lowered.
- Mexico witnessed a jump in headline inflation, but core data suggests the Bank of Mexico (Banxico) has done a good job, curbing elevated prices after hiking rates toward 11.25%.
- Despite indications from the December meeting minutes of Banxico (the Central Bank of Mexico) that the bank may consider easing its monetary policy, the inflation report for December poses a potential obstacle to any such policy relaxation.
- Analysts at Standard Chartered noted, “We expect the policy rate to be lowered to 9.25% by end-2024, although an official downward revision in the output gap could open the door for more aggressive rate cuts.”
- On January 5, a Reuters poll suggested the Mexican Peso could weaken 5.4% to 18.00 per US Dollar in the 12 months following December.
Technical analysis: Mexican Peso stays firm as USD/MXN meanders around 100-day SMA
The USD/MXN remained trading sideways on Friday, though with a tilt to the upside as buyers reclaimed the 17.00 psychological barrier. If they push the exchange rate toward the 200-day Simple Moving Average (SMA) at 17.36, that could pave the way to test the 100-day SMA at 17.42. That level comes ahead of the December 5 high at 17.56 and the May 23 high of 17.99.
On the other hand, the ongoing pullback below 17.20 could pave the way for a drop toward the 17.00 figure. Once cleared, further downside is expected at the January 8 low of 16.78. Once surpassed, the next support would be the August 28 cycle low of 16.69, ahead of last year’s low of 16.62.
USD/MXN Price Action – Daily Chart
Mexican Peso FAQs
What key factors drive the Mexican Peso?
The Mexican Peso (MXN) is the most traded currency among its Latin American peers. Its value is broadly determined by the performance of the Mexican economy, the country’s central bank’s policy, the amount of foreign investment in the country and even the levels of remittances sent by Mexicans who live abroad, particularly in the United States. Geopolitical trends can also move MXN: for example, the process of nearshoring – or the decision by some firms to relocate manufacturing capacity and supply chains closer to their home countries – is also seen as a catalyst for the Mexican currency as the country is considered a key manufacturing hub in the American continent. Another catalyst for MXN is Oil prices as Mexico is a key exporter of the commodity.
How do decisions of the Banxico impact the Mexican Peso?
The main objective of Mexico’s central bank, also known as Banxico, is to maintain inflation at low and stable levels (at or close to its target of 3%, the midpoint in a tolerance band of between 2% and 4%). To this end, the bank sets an appropriate level of interest rates. When inflation is too high, Banxico will attempt to tame it by raising interest rates, making it more expensive for households and businesses to borrow money, thus cooling demand and the overall economy. Higher interest rates are generally positive for the Mexican Peso (MXN) as they lead to higher yields, making the country a more attractive place for investors. On the contrary, lower interest rates tend to weaken MXN.
How does economic data influence the value of the Mexican Peso?
Macroeconomic data releases are key to assess the state of the economy and can have an impact on the Mexican Peso (MXN) valuation. A strong Mexican economy, based on high economic growth, low unemployment and high confidence is good for MXN. Not only does it attract more foreign investment but it may encourage the Bank of Mexico (Banxico) to increase interest rates, particularly if this strength comes together with elevated inflation. However, if economic data is weak, MXN is likely to depreciate.
How does broader risk sentiment impact the Mexican Peso?
As an emerging-market currency, the Mexican Peso (MXN) tends to strive during risk-on periods, or when investors perceive that broader market risks are low and thus are eager to engage with investments that carry a higher risk. Conversely, MXN tends to weaken at times of market turbulence or economic uncertainty as investors tend to sell higher-risk assets and flee to the more-stable safe havens.
- The EUR/GBP pair trades at 0.8584, recording a 0.30% gain, showcasing a pause in the bearish momentum.
- Weak Retail Sales figures from the UK from December give reasons for sticky inflation to ease.
- The overall trend for the cross is still tilted to the downside.
In Friday's session, the EUR/GBP pair was sighted at 0.8584, appreciating by 0.30%. After two consecutive days of losses, a neutral to bearish outlook persists in the daily chart as bears take a pause. However, in the four-hour chart, there's a change of scenery with bulls establishing their momentum.
On the fundamental side, the Pound Sterling is experiencing a significant sell-off following the Office for National Statistics's (ONS) report of a steep drop in December's Retail Sales. Sales, excluding fuel, fell by 3.3%, far below the expected 0.6% decrease. Additionally, the measure that excludes fuel declined by 2.1%, against a forecasted 1.3% rise. This unexpected decrease in Retail Sales, including a 3.2% monthly drop in in-store sales, is likely to impact the persistently high inflation outlook, which may push the Bank of England to consider sooner rate cuts. In that sense, if hawkish bets start to ease, the GBP may find further downside.
Technically speaking, the current position of the pair, sitting below the 20, 100, and 200-day Simple Moving Averages (SMAs), sends a clear signal that sellers hold the upper hand in the broader market outlook. The negative slope of the Relative Strength Index (RSI), even though in negative territory, indicates a hint of upward momentum, but it may not be enough to overturn the bearish sentiment. Additionally, the flat red bars of the Moving Average Convergence Divergence (MACD) entail a stalemate between buyers and sellers, consolidating the bear's control over the pair's direction. Furthermore, the bears seem to be pausing after two days of marked losses, underlining the short-term bearish view.
Shifting the focus to the shorter-term momentum, the four-hour chart presents a somewhat different scenario. Here, even though the RSI is still sloping upward within the negative territory, the gathered momentum by the bulls may spark a bout of buying pressure, while the MACD’s flat red bars also suggest that the bears are taking a breather.
EUR/GBP technical levels
EUR/GBP daily chart
-638412777364196234.png)
The late 2023 rally in AUD/USD has faded somewhat in early 2024. Economists at Danske Bank analyze the pair’s outlook.
AUD/USD remains firmly in the hands of global risk sentiment
With Australian leading indicators pointing firmly downward, and US economic data still remaining solid, we expect relative rates and growth to weigh on AUD/USD going forward.
AUD/USD remains firmly in the hands of global risk sentiment, where the outlook for inflation and rate cuts remains a key driver.
We generally think that the Fed will opt for a more gradual pace for rate cuts, which will be a supportive factor for broad USD. We maintain our downward-sloping forecast profile unchanged.
AUD/USD Forecast: 0.6600 (1M), 0.6400 (3M), 0.6300 (6M), 0.6200 (12M)
EUR/USD could be somewhere near 1.1500 by end-2024, economists at ING report.
A dose of patience is required
We retain a 1.1500 end-year forecast for EUR/USD but see range trading in the near term.
While a re-assessment of the aggressively priced European Central Bank easing cycle could in theory be positive for the Euro, a deteriorating investment environment could well curtail any sizable near-term gains in EUR/USD and other risk-sensitive currencies.
EUR/USD – 1M 1.0800 3M 1.0800 6M 1.1000 12M 1.1500
Strategists at Commerzbank discuss poor sentiment in the metals markets.
No positive impetus for metal prices
The market balance figures from the International Copper Study Group are likely to confirm that the supply situation on the copper market improved last year. They therefore do not promise a boost for the struggling metal markets.
The Oil market is also sufficiently supplied. However, Oil prices remain well supported by the tensions in the Middle East.
The Gold price is also unlikely to fall much lower, as US key interest rates will be reduced later than some had hoped, but they will fall.
The US Dollar (USD) is poised to notch up a solid gain on the week. Economists at Scotiabank analyze Greenback’s outlook.
The underlying trend remains USD positive in general
The underlying trend remains USD positive in general and a bit more USD strength overall seems more likely than not in the coming weeks.
Fed repricing, USD bullish seasonal trends and supportive medium term technical pointers all suggest that the US Dollar is likely to strengthen or at least remain better supported for now.
The Euro loses steam as German Producer Prices drop beyond expectations.
In Japan, the soft inflation data is weighing on a sharper JPY recovery.
EUR/JPY faces a significant resistance at 161.80.
The Euro retreated against the Japanese Yen ahead of Friday's European session opening. Weak German PPI data weighed on the Common currency, which found buyers in the upper ranges of 160.00.
German Producer Prices declined 1.2% in November and 8.6% year-on-year, well beyond the 0.5% monthly and 8% yearly decline anticipated by the market.
These data confirm the deflationary trend observed by ECB policymakers at the minutes of the last monetary policy meeting and are contributing to keep Euro upside attempts limited, despite the brighter market sentiment.
In Japan, the Nationwide CPI corroborated the soft inflation figures shown by last week’s Tokyo reading. The core inflation eased to a 2.3% yearly pace, its lowest level in one and a half years, suggesting that next week’s BoJ monetary policy meeting will be a non-event.
EUR/JPY Technical Analysis
The broader trend remains bullish although the pair faces a strong resistance at the 161.85 area. This is the 78.6% Fibonacci retracement of the late 2023 sell-off, often a target for corrective movements.
Support levels at 160.65 and 160.00 are keeping bears at bay for now. A break below 158.45 would cancel the positive view.
On the upside, above 161.85, the next targets are 162.30 and 162.95.
Technical Levels to Watch
The Canadian Dollar (CAD) edges slightly higher but scope for gains looks limited, economists at Scotiabank report.
Uptrend in place since the start of the year remains intact
USD/CAD has drifted from the high around 1.3540 seen earlier in the week but losses are relatively mild and the broader uptrend in the USD in place since the start of the year remains intact.
Shorter-term trend oscillators are leaning USD-bullish still.
Spot may edge a little lower in the short run as price action corrects from the test of the 50% Fibonacci resistance from the USD’s Q4 drop (1.3538) but the USD should find support on dips to the low/mid-1.3400s absent any sign of a reversal in the USD bull trend at this point.
- GBP/JPY falls sharply from 189.00 as the Pound Sterling hit by weaker Retail Sales data.
- Vulnerable UK consumer spending data has deepened recession fears.
- Market participants shift focus towards the BoJ policy meeting.
The GBP/JPY pair drops from fresh eight-year high of 189.00 in the early New York session. The cross faces pressure as the United Kingdom Retail Sales contracted sharply in December despite festive season.
The Office for National Statistics (ONS) has reported that significant fall in sales at food stores and early Christmas shopping resulted in a sharper decline in the overall consumer spending. Meanwhile, higher consumer spending was also dented by deep cost-of-living crises due to higher interest rates and stubborn price pressures.
Annual Retail Sales suffered a steep contraction of 2.4% while market participants projected a strong growth of 1.1%. A vulnerable consumer spending has renewed fears of a technical recession in the UK economy.
Investors should note that the UK economy contracted by 0.1% in the third quarter of 2023 as per the revised estimates from the UK ONS. Latest projections from the Bank of England (BoE) indicated that the economy is not expected to show any growth in the final quarter of 2023. If the Q4 Gross Domestic Product (GDP) contracts, it would be right to state the UK economy in a technical recession.
Going forward, it would be challenging for Bank of England (BoE) policymakers to retain restrictive monetary policy stance for ensuring a price stability or deliver a dovish decision due to dismal economic outlook.
On the Japanese Yen front, market participants await Bank of Japan’s (BoJ) first monetary policy meeting, which is scheduled for Tuesday. The BoJ is unlikely to emphasize on exiting the decade-long ultra-loose monetary policy due to unfavorable Middle East tensions, easing consumer price inflation and slower wage growth.
Sideways range for the GBP/USD pair in place over the past month or so remains intact, economists at Scotiabank report.
Neither technical chart provides any strong insight into directional risks
Sterling has weakened on the day so far but the GBP/USF pair has edged off the earlier low and holding just below the mid-point of the flat 1.2600-1.2825 trading range in place since mid-December.
More range trading is likely for now.
Neither the daily nor weekly charts are providing any strong insight into directional risks.
- The Canadian Dollar loses ground as Canadian Retail Sales disappoint.
- Retail consumption declined 0.2% in November against market expectations of a flat reading.
- Longer-term, the US Dollar maintains its positive trend from late December lows intact.
The US Dollar nudged higher on Friday, following an unexpected decline in Canadian Retail sales. The pair bounced up from intra-day lows near 1.3450 although it remains negative on the daily chart.
Retail consumption declined 0.2% in Canada in November, against expectations of flat performance, following a downwardly revised 0.5% increase in the previous month. Excluding autos, sales of all other products fell 0.5%, beyond the 0.1% contraction expected.
Beyond that, Statistics Canada reported that the amount of employment insurance beneficiaries rose by 1.7% in November. This is the largest increase since August and adds to evidence that the Canadian economy is losing momentum.
Later today the US Michigan Consumer Sentiment Index is expected to show a moderate improvement before a speech of the San Francisco Fed President, Mary Daly, which will close the week.
USD/CAD Technical Analysis
The US Dollar is correcting lower following a sharp rally in the previous three weeks. The broader trend, however, remains positive, with the bullish cross on 4h SMAs adding credence for bulls.
Support levels are the mentioned 1.3450 and the 38.2% Fibonacci retracement of January;’s rally, at 1.3410. Resistances are at 1.3500 area and 1.3545.
Technical Levels to Watch
The Japanese Yen (JPY) has experienced notable swings on the back of US Dollar (USD) action and central bank commentary. Economists at the National Bank of Canada analyze USD/JPY outlook.
Raising rates while much of the world is set to ease could set up JPY for appreciation
The much-discussed abandonment of abnormal monetary policy (read: negative rates) has yet to materialize despite inflationary pressures.
The Bank of Japan is showing reticence to ditch loose policy until inflation is sustainably at 2%. That said, it is contending with an acceleration in wages which should put pressure on to normalize policy.
A first rate hike could occur in the Spring (perhaps April). As such, raising rates while much of the world is set to ease could set up the island nation currency for appreciation.
We see the Yen gaining ground all through 2024.
- The New Zealand Dollar has found support at 0.6690 although upside attempts remain capped below 0.6135.
- New Zealand's Business PMI and Visitor arrivals have failed to support the Kiwi.
- The brighter market sentiment is weighing the US Dollar.
The New Zealand Dollar’s bearish momentum has lost stream although price action is struggling to find acceptance above the 0.6125/35 resistance area so far.
The improved market sentiment is providing some support to the Kiwi on Friday. Most European markets are going through moderate advances and Wall Street futures are pointing to a positive opening, which is weighing on the Safe-haven USD.
New Zealand data released earlier today revealed that business activity deteriorated further in December, while visitor arrivals experienced a significant decline compared to the same time last year. This was bad news for the Kiwi.
In the US Calendar, the highlight of the day will be the Michigan Consumer Sentiment Index, which is expected to have improved moderately. After that, San Francisco Fed President, Mary Daly will close the week.
NZD/USD Technical Analysis
The technical picture remains bearish although the doji candles on the Daily chart and the strong support area above 0.6070 suggest the possibility of an upside correction.
Immediate resistance is at 0.6135 and above here, 0.6180. Sup[ports are at the mentioned 0.6070/90 and 0.6000.
Technical Levels to Watch
- USD/JPY finds support near 148.00 as bets favouring a rate-cut decision by the Fed are fading away.
- Fed Daly is expected to support the ‘restrictive interest rates’ narrative amid stubborn inflation.
- Soft inflation data could force the BoJ to delay loose-policy exit plans.
The USD/JPY pair attempts to recover after discovering an interim support near 148.00. The asset is aiming to rebound as the US Dollar Index (DXY) is gaining traction due to tempered bets supporting an interest rate cut by the Federal Reserve (Fed) in March.
As per the CME Fedwatch tool, traders see a 53% chance for an interest rate cut by 25 bps in March, which were above 70% last week.
S&P500 futures have added significant gains in the European session, portraying a significant improvement in the risk-appetite for equity-asset class. The USD Index demonstrates a sharp contraction in volatility amid absence of the release of the front-line economic indicators. 10-year US Treasury yields have eased to near 4.13%.
Going forward, market participants will focus on the commentary from San Francisco Fed Bank President Mary Daly, who is expected to support the ‘higher interest rates’ narrative beyond March. The argument in favour of keeping interest rates at restricted levels would be supported by stubborn price pressures, steady labor demand and robust consumer spending.
On the Tokyo front, investors hope that the Bank of Japan (BoJ) could delay their plans of exiting from the ultra-loose monetary policy due to slower wage growth. Meanwhile, producers at factory gates are struggling to raise prices of goods and services due to subdued demand.
Apart from that, the National headline Consumer Price Index (CPI) data for December decelerated to 3.7% against the prior reading of 3.6%. Inflation data excluding fresh foods also softened to 2.3% as expected against the former reading of 2.5%.
EUR/USD holds range around 1.0900 in quiet trade. Economists at Scotiabank analyze the pair’s outlook.
The market undertone remains soft
Spot looked vulnerable to more downside movement earlier in the week as the market (twice) tested the mid-1.0800 area but the lack of follow through selling pressure has averted more EUR losses for now, at least. The market undertone remains soft, however, with short-term trend oscillators and longer run price signal leaning EUR-negative.
EUR gains through 1.0910/1.0920 might give the market a short-term lift but there seems just as little interest in chasing the EUR higher as there was to lean on the downside earlier this week.
Gold has been under pressure as the market mulled the Fed’s interest rate path. Strategists at Commerzbank analyze the yellow metal’s outlook.
Weak demand from automotive industry and downturn in Gold are weighing on Palladium
Prices on the precious metal exchanges are under pressure: Palladium is the biggest loser, dropping around 15% since the beginning of the year. Weak demand from the automotive industry and the recent downturn in the Gold market are weighing on the price. The latter is mainly due to disappointed hopes of quick interest rate cuts.
We believe that the first interest rate cut in the US is not expected until May, so the Gold price is unlikely to make any major leaps in the short term.
- The US Dollar trades at small gains in a dispersed market.
- Traders are left clueless ahead of the Fed meeting next week.
- The US Dollar Index closed above important resistance, though fell back below it on Friday’s opening.
The US Dollar (USD) consolidates with lower highs and higher lows after the volatility pickup earlier this week. Traders are left clueless ahead of the first US Federal Reserve meeting to be held next week. Although it becomes clear no rate cut will take place, traders have only delayed their rate-cut expectations until May, (from March), which makes it difficult for the Greenback to rally substantially.
On the economic front, there is only one element that might push the US Dollar in either way, which is the University of Michigan Consumer Sentiment Index for January, together with inflation expectations. As seen earlier this week with some soft indicators like the NY Empire Manufacturing Index and the Philadelphia Manufacturing number all remaining very weak, a contraction in the Michigan Sentiment number could make traders push forward March again for an initial rate cut from the Fed.
Daily digest market movers: Michigan in the spotlight
- Fresh US air strikes took place against Houthi rebels on Thursday evening.
- The Senate’s stopgap funding bill has had enough votes to pass and is now making its way to the House.
- Near 15:00 GMT the University of Michigan will release its numbers:
- The Consumer Sentiment Index for January is expected to head from 69.7 to 70. Analysts are seeing lowest at 66 and highest estimate at 72.5.
- Any number above 72.5 will trigger an ample amount of US Dollar strength, while any print below 66 will be good for substantial US Dollar weakness.
- Inflation expectations are expected to head from 2.9% to 3.0%.
- Equity markets have shown resilience and have rebounded quite a lot. European equities are nearly erasing all incurred losses from this week and might head to a flat close for this week’s performance should the current gains be extended into the European close on Friday. US equities see the Dow Jones nearly paring back losses from earlier this week while the Nasdaq is already ahead of that option and is firmly in the green for this week’s close.
- The CME Group’s FedWatch Tool shows that markets are pricing in a 97.4% chance that the Federal Reserve will keep interest rates unchanged at its January 31 meeting. Around 2.6% expect the first cut already to take place.
- The benchmark 10-year US Treasury Note remains steady at 4.13%, making it a five-day winning streak.
US Dollar Index Technical Analysis: March or May or whenever
The US Dollar Index (DXY) is caught between a rock and a hard place on the charts. Although the moves earlier this week looked bullish, it makes sense that the US Dollar was unable to steam away and perform a substantial rally on the DXY chart. Reason for that is that traders only have rebalanced their bets for an initial rate cut by the Fed from March to June, which indeed asks for some higher valuation of the US Dollar, though possibly not enough to move away from the 55-day and the 200-day Simple Moving Averages (SMA) near 103.33 and 103.46 respectively.
The DXY is trading smack in the middle of those two moving averages this Friday. In case the DXY can get through that area again and run away, look for 104.44 as the first resistance level on the upside, in the form of the 100-day SMA. If that gets scattered as well, nothing will hold the DXY from heading to either 105.88 or 107.20, the high of September.
Risk of a bull trap is still a possible outcome, where US Dollar bulls were caught buying into the Greenback when it broke above both the 55-day and the 200-day SMA in early Wednesday trading. Price action could decline substantially and force US Dollar bulls to sell their positions at a loss. This would see the DXY first drop to 102.60, at the ascending trend line from September. Once threading below it, the downturn is open to head to 102.00.
US Dollar FAQs
What is the US Dollar?
The US Dollar (USD) is the official currency of the United States of America, and the ‘de facto’ currency of a significant number of other countries where it is found in circulation alongside local notes. It is the most heavily traded currency in the world, accounting for over 88% of all global foreign exchange turnover, or an average of $6.6 trillion in transactions per day, according to data from 2022.
Following the second world war, the USD took over from the British Pound as the world’s reserve currency. For most of its history, the US Dollar was backed by Gold, until the Bretton Woods Agreement in 1971 when the Gold Standard went away.
How do the decisions of the Federal Reserve impact the US Dollar?
The most important single factor impacting on the value of the US Dollar is monetary policy, which is shaped by the Federal Reserve (Fed). The Fed has two mandates: to achieve price stability (control inflation) and foster full employment. Its primary tool to achieve these two goals is by adjusting interest rates.
When prices are rising too quickly and inflation is above the Fed’s 2% target, the Fed will raise rates, which helps the USD value. When inflation falls below 2% or the Unemployment Rate is too high, the Fed may lower interest rates, which weighs on the Greenback.
What is Quantitative Easing and how does it influence the US Dollar?
In extreme situations, the Federal Reserve can also print more Dollars and enact quantitative easing (QE). QE is the process by which the Fed substantially increases the flow of credit in a stuck financial system.
It is a non-standard policy measure used when credit has dried up because banks will not lend to each other (out of the fear of counterparty default). It is a last resort when simply lowering interest rates is unlikely to achieve the necessary result. It was the Fed’s weapon of choice to combat the credit crunch that occurred during the Great Financial Crisis in 2008. It involves the Fed printing more Dollars and using them to buy US government bonds predominantly from financial institutions. QE usually leads to a weaker US Dollar.
What is Quantitative Tightening and how does it influence the US Dollar?
Quantitative tightening (QT) is the reverse process whereby the Federal Reserve stops buying bonds from financial institutions and does not reinvest the principal from the bonds it holds maturing in new purchases. It is usually positive for the US Dollar.
The US Dollar (USD) is still on top across G10 and EM FX. Economists at ING analyze Greenback’s outlook.
Dollar can stay broadly supported into the 31 January FOMC
We think the Dollar can consolidate after the recent gains, continuing to draw some benefits from Christopher Waller’s remarks earlier this week, which may have led markets to favour defensive positions heading into the FOMC on 31 January.
The only key data release in the US before then is the fourth quarter GDP figures next week, and barring major surprises there, there is no compelling bearish story for the next week or so.
The Pound Sterling (GBP) sustained its good form of 2023 in early 2024 following the upside surprise for the UK Consumer Price Index (CPI) in December. Economists at ING analyze EUR/GBP outlook.
EUR/GBP may struggle to find sustainable support above 0.8600 for now
We expect some 100 bps of BoE cuts this year. Since we also deem ECB rate cut bets as too aggressive, we are bullish on EUR/GBP into year-end. However, we think that the back up in EUR rates will be gradual and markets will be reluctant to let go of high-yielding GBP longs so close to the surprise December CPI print.
Accordingly, EUR/GBP may struggle to find sustainable support above 0.8600 for now. The 0.8640 is where 50, 100 and 200-Day Moving Averages converge, and could be the next big resistance.
EUR/USD tested yearly lows in the mid 1.0800-1.0900 range. Economists at ING analyze the world’s most popular currency pair outlook.
Markets were unmoved from the minutes of the December ECB meeting
Markets were unmoved from the minutes of the December European Central Bank (ECB) meeting on Thursday, in which members steered away from discussing rate cuts.
Today, the Eurozone calendar is empty, and we think EUR/USD can consolidate around 1.8500/1.0900.
See: FX market likely to be reluctant to trade EUR lower before ECB meeting – Commerzbank
- WTI Oil jumps near 1% after Reuters reported overnight drone attacks in Russia.
- Russia may be forced to break its OPEC production commitment in order to provide more supply to the war front.
- The US Dollar Index caught at mid-103 level after traders repriced rate cut bets from March to May.
Oil prices are jumping higher with Reuters reporting Ukraine was able to strike a strategic Oil depot near St Petersburg. The domestic-made drone flew 1,250 km and was able to hit the projected target in a new offensive out of Ukraine to hit more key Oil storages that are partially used to provide fuel to the Russian war front. Russia from their side, did not confirm the strikes, though came out saying that several drones were shot from the sky with Russian defence systems.
Meanwhile, the DXY US Dollar Index is caught in a difficult spot on the charts between two technical elements. The fact that the Greenback is unable to rally substantially comes with the rather small tweaking traders made to their positions, pushing back their rate cut bets from March to May. This makes the US Dollar able to strengthen a bit, but not substantially enough to move away from its current levels.
Crude Oil (WTI) trades at $74.44 per barrel, and Brent Oil trades at $79.22 per barrel at the time of writing.
Oil News and Market Movers: Russia faces drone attacks
- Earlier this week headlines were coming out already that Russia was not complying with its OPEC production cut agreements. To make matters worse, Ukraine has started a new phase in its offence by attacking key Oil installations in Russia with drones. This could force Russia to pump up more Oil for its own use.
- The Energy Information Agency (EIA) released Crude Oil Stock changes for the US on Thursday, with a drawdown of 2.492 million barrels against a build of 1.338 million last week.
- The drawdown could be a side effect of the frost in Texas where refiners need to draw from the Cushing reserves with a key import pipeline closed for deliveries in the region and LNG terminals closed under the severe weather conditions.
- The week will get closed off with the Baker Hughes US Oil Rig Count near 18:00 GMT. Previously there was a count of 499.
Oil Technical Analysis: Russia faces fallout
Oil prices are set to close this week off in the green for both this Friday and its weekly performance. The number of geopolitical tensions are only broadening now that the Houthi rebels and the US are at a direct conflict. With these new drone attacks from Ukraine into Russia, the risk of retaliation from Russia will enlarge and might lead to the use of unconventional weapons on the battlefield.
On the upside, $74 continues to act as a line in the sand after yet another failed break above it on Friday last week. Although quite far off, $80 comes into the picture should tensions build further. Once $80 is broken, $84 is next on the topside once Oil sees a few daily closes above the $80 level.
Below $74, the $67 level could still come into play as the next support to trade at, as it aligns with a triple bottom from June. Should that triple bottom break, a new low for 2023 could be close at $64.35 – the low of May and March – as the last line of defence. Although still quite far off, $57.45 is worth mentioning as the next level to keep an eye on if prices fall sharply.
-638412576829226962.png)
US WTI Crude Oil: Daily Chart
WTI Oil FAQs
What is WTI Oil?
WTI Oil is a type of Crude Oil sold on international markets. The WTI stands for West Texas Intermediate, one of three major types including Brent and Dubai Crude. WTI is also referred to as “light” and “sweet” because of its relatively low gravity and sulfur content respectively. It is considered a high quality Oil that is easily refined. It is sourced in the United States and distributed via the Cushing hub, which is considered “The Pipeline Crossroads of the World”. It is a benchmark for the Oil market and WTI price is frequently quoted in the media.
What factors drive the price of WTI Oil?
Like all assets, supply and demand are the key drivers of WTI Oil price. As such, global growth can be a driver of increased demand and vice versa for weak global growth. Political instability, wars, and sanctions can disrupt supply and impact prices. The decisions of OPEC, a group of major Oil-producing countries, is another key driver of price. The value of the US Dollar influences the price of WTI Crude Oil, since Oil is predominantly traded in US Dollars, thus a weaker US Dollar can make Oil more affordable and vice versa.
How does inventory data impact the price of WTI Oil
The weekly Oil inventory reports published by the American Petroleum Institute (API) and the Energy Information Agency (EIA) impact the price of WTI Oil. Changes in inventories reflect fluctuating supply and demand. If the data shows a drop in inventories it can indicate increased demand, pushing up Oil price. Higher inventories can reflect increased supply, pushing down prices. API’s report is published every Tuesday and EIA’s the day after. Their results are usually similar, falling within 1% of each other 75% of the time. The EIA data is considered more reliable, since it is a government agency.
How does OPEC influence the price of WTI Oil?
OPEC (Organization of the Petroleum Exporting Countries) is a group of 13 Oil-producing nations who collectively decide production quotas for member countries at twice-yearly meetings. Their decisions often impact WTI Oil prices. When OPEC decides to lower quotas, it can tighten supply, pushing up Oil prices. When OPEC increases production, it has the opposite effect. OPEC+ refers to an expanded group that includes ten extra non-OPEC members, the most notable of which is Russia.
- The USD remains steady near one-month highs, consolidating gains after a six-day rally.
- Comments by SNB Chief Thomas Jordan complaining about CHF strength are weighing on the Swissie.
- A moderate risk appetite is holding the USD back on Friday.
The US Dollar is consolidating gains near omne-month highs against the ASwiss Fran. The comments by SNB Chief, Thomas Jordan, suggesting that the strength of the Swiss Franc will determine the bank’s monetary policy decisions, is acting as a headwind for any significant CHF recovery.
The US Dollar remains buoyed with investors tempering rate-cut bets
In the US, the stronger-than-expected Jobless Claims and Retail Sales data have contributed to cool market hopes of early and aggressive Fed cuts in 2024, which has fuelled the US Dollar across the board.
Beyond that, an array of Federal Reserve policymakers have hit the wires, downplaying expectations of interest rate cuts in the coming months. Atlanta Fed President Raphael Bostic affirmed on Thursday that he does not expect rate cuts until the third quarter of the year.
The Dollar, however, is trading without a clear direction on Friday. A brighter market sentiment, and some profit-taking, as we head into the weekend, might be weighing the Greenback Later today the Michigan Consumer Sentiment Index and a speech by San Francisco Fed President, Mary Daly, might give a fresh push to the USD.
USD/CHF Technical Analysis
The USD maintains its bullish structure intact after breaching the 38.2% Fibonacci retracement of the late 2023 decline, at 0.8675. The next targets are now 0.8720 and the 50% Fib retracement, at 0.8780 although the overbought levels on intra-day charts suggest that the current consolidation might extend.
Support levels are 0.8670 and 0.8635.
Technical levels to watch
The Japanese Yen (JPY) has lost considerable ground against the US Dollar (USD) since the beginning of the year. Economists at Commerzbank analyze USD/JPY outlook.
Scepticism about Japanese monetary policy has weighed on the Yen
USD/JPY has staged a move higher this month. Even if the stronger Dollar may have been partly responsible, scepticism about Japanese monetary policy is also likely to have played a role.
If the BoJ makes it clear next week that it does not intend to change its expansionary course for the time being – which we believe is likely – USD/JPY could rise a little further.
- EUR/GBP marches towards 0.8600 on vulnerable UK Retail Sales data.
- The BoE could discuss for early interest rate cuts as recessions fears deepen.
- ECB may look for reducing interest rates from late summer.
The EUR/GBP pair is advancing towards the round-level resistance of 0.8600 in the European session. The asset has strengthened as the United Kingdom Office for National Statistics (ONS) has reported a vulnerable Retail Sales data for December.
UK households reduced their spendings significantly despite festive season as their pockets shrank due to deepening cost-of-living crisis. Higher interest rates by the Bank of England (BoE) and stubbornly stubborn inflation have dented purchasing power.
Massive decline in the UK Retail Sales indicate that the economy is in a deep trouble while price pressures remain elevated. The economy also contracted in the third quarter of 2023 as per the revised estimates from the ONS agency. The outlook for the UK economy is downbeat, therefore fears of a technical recession would keep BoE policymakers on their toes.
The BoE would struggle between higher underlying inflation and deepening recession fears, instructing to adopt a careful approach for rate cuts ahead.
On the Eurozone front, European Central Bank (ECB) President Christine Lagarde has pushed back expectations of a rate cut to late summer, cautioning higher inflation from where the central bank wants. While other ECB policymakers are still keeping interest rate cuts off the table.
Dollar’s bounce does not look done yet, Kit Juckes, Chief Global FX Strategist at Société Générale, says.
Rate and FX re-pricing can still help USD and hurt GBP
This week saw more weakness in manufacturing, in hard data and surveys, but solid retail sales and an ever-tightening labour market have pushed longer-dated yields up. The data and the rate move have supported the USD but looked at in this way, the impression is that there is potentially more to go. The Dollar’s bounce isn’t necessarily over yet.
As for the UK, we’ve seen enough softness in labour market and retail sales data this week that further downside in EUR/GBP is very limited, and there is room for GBP/USD to drift to 1.2500 before we get the mid-February UK data blast.
- The Aussie is shrugging off bearish pressure to regain lost ground.
- A brighter market mood and a somewhat softer US Dollar are buoying the AUD.
- AUD/USD needs to confirm above 0.6600 to set its focus at the 0.6650 key resistance area.
The Australian Dollar is building up some positive momentum on Friday’s European session. The brighter sentiment, with European markets trading in a moderately positive tone, and some profit-taking after the sharp US dollar rally seen this week are pushing the Aussie higher.
The US Dollar loses steam as market sentiment improves
The US Dollar Index is practically flat on the day, capped below one-month highs for the third consecutive day. The rally on US Treasury yields has lost steam and the Dollar might need some new arguments to extend January's 2.8% rally.
Recent data from the US has been USD-supportive. Jobless claims declined against expectations last week, which endorses the view of a resilient economy and adds to evidence that the market had got ahead of itself with rate cut expectations in December.
Beyond that, data from China confirmed that the world’s second target economy is struggling. The fourth quarter’s GDP and Retail Sales came below expectations, leaving investors anxious for bolder stimulus measures, and increasing negative pressure on the China-proxy AUD.
AUD/USD Technical analysis
The Australian Dollar is correcting higher on Friday, coming up from strongly oversold levels after a 4.5% sell-off in January. The pair is now pushing against resistance at the 0.6600 area heading to a stronger resistance area, at 0.6640/50.
On the downside, a bearish reversal below 0.6520 would resume the broader bearish trend and increase pressure towards 0.6450.
Technical levels to watch
Gold price fell almost to the $2,000 mark this week, its lowest level in more than a month. Economists at Commerzbank analyze the yellow metal’s outlook.
Correction of interest rate cut expectations puts Gold and Silver under pressure
Better-than-expected US data on retail sales, industrial production and the real estate market led to a noticeable reduction in Fed rate cut expectations. According to Fed Fund Futures, a rate cut in March is now only expected with a probability of just over 50%. The interest rate cuts expected for the first half of the year were revised downwards by around 20 bps over the course of the week. As a result, US bond yields rose significantly and the USD appreciated. All of this acted as a headwind for Gold.
The price of Silver came under even greater pressure than Gold. It fell to a two-month low of $22.4, pushing the Gold/Silver ratio back up to almost 90.
As long as the correction in interest rate cut expectations continues, Gold and Silver are likely to remain on the backfoot.
- The Euro remains flat above 1.0845 with the broader bearish trend intact.
- The strong US data seen this week has dampened hopes of Fed cuts, boosting the US Dollar.
- ECB President Lagarde discards rate cuts before next summer, which has provided some support to the Euro.
The Euro (EUR) is trading within a tight range, unable to put a significant distance from the one-month lows at 1.0845 on Friday’s European trading session. The strong US macroeconomic data seen this week have forced investors to reassess their interest rate expectations, which has boosted the US Dollar across the board.
Data released on Thursday revealed that US initial jobless claims declined against expectations in the week of January 12. These figures confirm the picture of a resilient US economy shown by the strong Retail Sales seen earlier this week and suggest that the Federal Reserve (Fed) has still some work to do to bring inflation to the target level.
On the calendar today, European Central Bank (ECB) President Christine Lagarde will speak for the last time before the two-week blackout ahead of January’s monetary policy meeting.
In the US, the Michigan Consumer Sentiment Index and the University of Michigan Consumer Inflation expectations will focus the attention. Somewhat Later San Francisco Fed President, Mary Daly, might give some more info about the bank’s monetary policy outlook.
Daily digest market movers: Euro hovers near one-month lows, weighed by USD strength
- The Euro is hesitating above the 1.0845 support area as the US Dollar strengthens with investors scaling back hopes of Fed cuts.
- US Jobless claims eased to 187K in the week of January 12, down from 203K in the previous week and against expectations of an increase to 207K.
- US Unemployment levels corroborate the resilience of the US economy pouring more cold water on investor’s hopes of Fed cuts in March.
- The ECB monetary policy accounts released on Thursday reflect the policymakers' conviction that inflation is subsiding, however, rate cuts are still off the table.
- ECB President Lagarde affirmed at the Davos World Economic Summit that the bank will not cut rates until next summer.
- Atlanta Fed President, Raphael Bostic does not see interest rate cuts coming until the third quarter.
- The CME Group FedWatch Tool shows a 55% chance of rate cuts in March, down from 75% last week.
Technical Analysis: EUR/USD remains biased lower with 1.0845 support holding bears for now
The EUR/USD remains practically flat on Friday and is on track for a 0.6% decline this week. The near-term bias is negative and the support level at 1.0845 is keeping the pair from further decline.
A clear break below 1.0845 would activate a bearish Head and Shoulders (H&S) pattern increasing negative pressure towards 1.0800 and 1.0725. The H&S measured target is the 78.6% Fibonacci retracement of the late 2023 rally, at 1.0600.
On the upside, Euro bulls are likely to meet a significant resistance at the 1.0920/30 area, where previous trendline support meets the confluence of the 4-hour 200 and 50 SMAs. Above here, the next target is 1.1000.
Euro FAQs
What is the Euro?
The Euro is the currency for the 20 European Union countries that belong to the Eurozone. It is the second most heavily traded currency in the world behind the US Dollar. In 2022, it accounted for 31% of all foreign exchange transactions, with an average daily turnover of over $2.2 trillion a day.
EUR/USD is the most heavily traded currency pair in the world, accounting for an estimated 30% off all transactions, followed by EUR/JPY (4%), EUR/GBP (3%) and EUR/AUD (2%).
What is the ECB and how does it impact the Euro?
The European Central Bank (ECB) in Frankfurt, Germany, is the reserve bank for the Eurozone. The ECB sets interest rates and manages monetary policy.
The ECB’s primary mandate is to maintain price stability, which means either controlling inflation or stimulating growth. Its primary tool is the raising or lowering of interest rates. Relatively high interest rates – or the expectation of higher rates – will usually benefit the Euro and vice versa.
The ECB Governing Council makes monetary policy decisions at meetings held eight times a year. Decisions are made by heads of the Eurozone national banks and six permanent members, including the President of the ECB, Christine Lagarde.
How does inflation data impact the value of the Euro?
Eurozone inflation data, measured by the Harmonized Index of Consumer Prices (HICP), is an important econometric for the Euro. If inflation rises more than expected, especially if above the ECB’s 2% target, it obliges the ECB to raise interest rates to bring it back under control.
Relatively high interest rates compared to its counterparts will usually benefit the Euro, as it makes the region more attractive as a place for global investors to park their money.
How does economic data influence the value of the Euro?
Data releases gauge the health of the economy and can impact on the Euro. Indicators such as GDP, Manufacturing and Services PMIs, employment, and consumer sentiment surveys can all influence the direction of the single currency.
A strong economy is good for the Euro. Not only does it attract more foreign investment but it may encourage the ECB to put up interest rates, which will directly strengthen the Euro. Otherwise, if economic data is weak, the Euro is likely to fall.
Economic data for the four largest economies in the euro area (Germany, France, Italy and Spain) are especially significant, as they account for 75% of the Eurozone’s economy.
How does the Trade Balance impact the Euro?
Another significant data release for the Euro is the Trade Balance. This indicator measures the difference between what a country earns from its exports and what it spends on imports over a given period.
If a country produces highly sought after exports then its currency will gain in value purely from the extra demand created from foreign buyers seeking to purchase these goods. Therefore, a positive net Trade Balance strengthens a currency and vice versa for a negative balance.
Interest rates FAQs
What are interest rates?
Interest rates are charged by financial institutions on loans to borrowers and are paid as interest to savers and depositors. They are influenced by base lending rates, which are set by central banks in response to changes in the economy. Central banks normally have a mandate to ensure price stability, which in most cases means targeting a core inflation rate of around 2%.
If inflation falls below target the central bank may cut base lending rates, with a view to stimulating lending and boosting the economy. If inflation rises substantially above 2% it normally results in the central bank raising base lending rates in an attempt to lower inflation.
How do interest rates impact currencies?
Higher interest rates generally help strengthen a country’s currency as they make it a more attractive place for global investors to park their money.
How do interest rates influence the price of Gold?
Higher interest rates overall weigh on the price of Gold because they increase the opportunity cost of holding Gold instead of investing in an interest-bearing asset or placing cash in the bank.
If interest rates are high that usually pushes up the price of the US Dollar (USD), and since Gold is priced in Dollars, this has the effect of lowering the price of Gold.
What is the Fed Funds rate?
The Fed funds rate is the overnight rate at which US banks lend to each other. It is the oft-quoted headline rate set by the Federal Reserve at its FOMC meetings. It is set as a range, for example 4.75%-5.00%, though the upper limit (in that case 5.00%) is the quoted figure.
Market expectations for future Fed funds rate are tracked by the CME FedWatch tool, which shapes how many financial markets behave in anticipation of future Federal Reserve monetary policy decisions.
- Gold price has extended its recovery to near $2,030 as the US Dollar turns sideways.
- A pullback move in the Gold price is less convincing as traders have pared bets for a Fed rate cut in March.
- Upbeat US Retail Sales numbers signal upside risks to US inflation.
Gold price (XAU/USD) rises further on Friday’s European session as the appeal for safe-haven assets improves due to the deepening Middle East conflict. Adding to the war in Gaza, tensions between Houthi rebels and the United States military are increasing in the key commercial shipping route crossing the Red Sea. Moreover, Pakistan carried out military strikes in Iran on Thursday following a similar attack by Iran in its territory.
In this context, the precious metal has recovered significantly, but the outlook in the near term has not turned bullish as further upside looks capped by diminishing bets supporting an interest-rate cut from the Federal Reserve (Fed.)
The outlook for inflation in the United States remains uncertain. Price growth is gradually declining, but recent data suggests that the economy is strong, particularly due to robust household spending. This adds to inflation pressures and makes it more likely that the Fed will maintain a restrictive monetary policy stance for a longer period.
The Fed is expected to keep interest rates unchanged in the range of 5.25%-5.50% for the fourth consecutive time at the monetary policy meeting on January 31. Market participants will focus on the commentary about how the Fed will fit the expected three interest rate cuts in the remaining seven policy meetings of 2024.
Daily digest market movers: Gold price recovers further as US Dollar remains subdued
- Gold price extends recovery to near $2,030 as the US Dollar has turned sideways after a strong upside move.
- The recovery in the Gold price is also backed by deepening geopolitical tensions, which have increased flows towards safe-haven assets.
- The appeal for safe-haven assets is upbeat as the Iran military group is expected to retaliate for airstrikes launched by the US military targeting Houthis in Yemen.
- In spite of supportive economic fundamentals, the Gold price is expected to end the week on a bearish note, weighed by lower Fed rate cuts bets due to a stable labor market, robust consumer spending, and a sticky inflation outlook.
- US Retail Sales were robust in December due to a sharp increase in demand for motor vehicles and online purchases, which set a positive undertone for 2024. An upbeat retail demand has escalated fears for inflation remaining persistent.
- US Initial Jobless Claims for the week ending January 12 fell significantly lower to 187K against expectations of 203K and the prior reading of 207K. This indicates that labor demand is upbeat despite the Fed maintaining interest rates at high levels.
- Strong economic data strengthens the argument supporting a restrictive interest rate environment.
- On Thursday, Atlanta Federal Reserve Bank President Raphael Bostic supported a reduction in interest rates, but only after the first half of this year as long as inflation declines towards the 2% target.
- Bostic cautioned about premature interest rate cuts as they could decelerate the progress in the achievement of price stability. Also, early rate cuts could bring an uptick in retail demand and spoil entire efforts made to tame price pressures. Bostic endorsed two interest rate cuts this year, diverging from the Fed’s median projections of three rate cuts.
- The US Dollar Index (DXY) sees a sharp contraction in volatility around 103.40. The USD Index trades slightly below its monthly high of 103.70, but it is expected to extend its recent recovery as investors scale back interest rate cut bets for March.
- As per the CME Group Fedwatch tool, traders see a 53% chance for an interest rate cut by 25 bps in March, sharply down from the above 70% seen last week.
Technical Analysis: Gold price recovers from 50-day EMA
Gold price jumped to near $2,030 on Friday. The precious metal recovered strongly after finding buying interest near the psychological support of $2,000. The yellow metal rebounded after taking support from the 50-day Exponential Moving Average (EMA), which trades around $2,017. However, the 20-day EMA near $2,035 is still acting as a barrier for the Gold price bulls. The 14-period Relative Strength Index (RSI) rebounded after testing territory near 40.00.
More upside could appear if Gold manages to stabilize above the $2,030 resistance, while the downside move could gain traction on a breakdown below the psychological supportof $2,000.
Gold FAQs
Why do people invest in Gold?
Gold has played a key role in human’s history as it has been widely used as a store of value and medium of exchange. Currently, apart from its shine and usage for jewelry, the precious metal is widely seen as a safe-haven asset, meaning that it is considered a good investment during turbulent times. Gold is also widely seen as a hedge against inflation and against depreciating currencies as it doesn’t rely on any specific issuer or government.
Who buys the most Gold?
Central banks are the biggest Gold holders. In their aim to support their currencies in turbulent times, central banks tend to diversify their reserves and buy Gold to improve the perceived strength of the economy and the currency. High Gold reserves can be a source of trust for a country’s solvency. Central banks added 1,136 tonnes of Gold worth around $70 billion to their reserves in 2022, according to data from the World Gold Council. This is the highest yearly purchase since records began. Central banks from emerging economies such as China, India and Turkey are quickly increasing their Gold reserves.
How is Gold correlated with other assets?
Gold has an inverse correlation with the US Dollar and US Treasuries, which are both major reserve and safe-haven assets. When the Dollar depreciates, Gold tends to rise, enabling investors and central banks to diversify their assets in turbulent times. Gold is also inversely correlated with risk assets. A rally in the stock market tends to weaken Gold price, while sell-offs in riskier markets tend to favor the precious metal.
What does the price of Gold depend on?
The price can move due to a wide range of factors. Geopolitical instability or fears of a deep recession can quickly make Gold price escalate due to its safe-haven status. As a yield-less asset, Gold tends to rise with lower interest rates, while higher cost of money usually weighs down on the yellow metal. Still, most moves depend on how the US Dollar (USD) behaves as the asset is priced in dollars (XAU/USD). A strong Dollar tends to keep the price of Gold controlled, whereas a weaker Dollar is likely to push Gold prices up.
US equities sit close to their all-time highs and 10-year US Treasuries trade with yields almost 100 basis points below their October peaks. Can equity and bond markets keep rising in 2024? Economists at UBS analyze market’s outlook.
Base case scenario is for a soft landing
Our base case scenario is for a soft landing. Lower interest rates, positive (albeit slowing) economic growth and growing corporate earnings should support modest further upside for equities.
We also think long-term bond yields have room to fall further, given long-term real rates are still higher than the Fed’s estimate of the real neutral rate, in our view. We favor bonds on a risk-adjusted basis.
US Dollar’s rebound develops a little more traction. However, Shaun Osborne, Chief FX Strategist at Scotiabank, expects USD to weaken from the second quarter of the year.
USD/CAD sellers can be patient for now
I still look for the USD to soften in Q2/Q3 as Fed easing risks are renewed and the US economy slows.
A broader easing in central bank policy in H2 should be supportive for risk appetite and add to USD headwinds later this year. Seasonality also turns generally USD-negative in Q2/Q3.
USD/CAD sellers can be patient for now; levels nearer 1.3500/1.3600 could be seen in the next few weeks.
- USD/CAD moves sideways with a positive bias toward an upward direction.
- US Dollar rose as investors’ sentiment toward Fed rate cuts diminished.
- The upcoming US and Mexican elections could put further pressure on MXN.
USD/MXN trims its intraday gain and continues its losing streak for the third straight session, trading near 17.16 during the European trading hours on Friday. However, the US Dollar (USD) received upward support as market participants have trimmed their bets on speculation of early interest rate cuts by the Federal Reserve in March, which could be attributed to the robust key economic data from the United States (US).
Additionally, the geopolitical tension in the Middle East turned the investors’ sentiment into risk aversion, which caused the increased demand for the US Dollar (USD). Additionally, the higher US bond yields contribute support to underpinning the Greenback. The 2-year and 10-year yields on US bond coupons trade at 4.35% and 4.15%, respectively, by the press time.
US Federal Reserve Bank of Atlanta President Raphael Bostic delivered remarks on Thursday at an event hosted by the Atlanta Chamber of Commerce. Bostic mentioned that the Fed's base case is to contemplate rate cuts in the third quarter, while also leaving open the possibility for an earlier commencement of the rate cut cycle, depending on inflation figures. Furthermore, traders will closely watch the US preliminary Michigan Consumer Sentiment Index, anticipating an improvement in January.
On Mexico’s side, markets have a sentiment that the upcoming 2024 elections in both Mexico and the US could potentially put further pressure on the performance of the Mexican Peso. Throughout the week, Mexico's economic calendar did not feature notable events, and market participants are now looking forward to the release of November's Retail Sales data on Friday. Projections indicate a month-over-month and year-over-year decrease at 0.5% and 3.2%, respectively, falling short of the previous figures.
The recent rise in Gold prices is set to continue, analysts at OCBC Bank say.
Gold to continue to trend higher on the back of falling real rates
We expect Gold to continue to trend higher on the back of falling real rates amid the Fed embarking on its rate cut cycle.
Our house view expects the Fed to start cutting rates in 2Q24 but markets typically price ahead of that.
In addition, the yellow metal also serves as a risk-off hedge (safe haven proxy) against geopolitical risks and portfolio diversifier. We are broadly constructive on the Gold outlook.
XAU/USD – 1Q24 $2,065 2Q24 $2,092 3Q24 $2,105 4Q24 $2,140
Gold prices rose in India on Friday, according to data from India's Multi Commodity Exchange (MCX).
Gold price stood at 62,014 Indian Rupees (INR) per 10 grams, up INR 259 compared with the INR 61,755 it cost on Thursday.
As for futures contracts, Gold prices increased to INR 62,094 per 10 gms from INR 61,769 per 10 gms.
Prices for Silver futures contracts decreased to INR 71,839 per kg from INR 71,615 per kg.
| Major Indian city | Gold Price |
|---|---|
| Ahmedabad | 64,150 |
| Mumbai | 63,990 |
| New Delhi | 64,135 |
| Chennai | 64,130 |
| Kolkata | 64,190 |
Global Market Movers: Comex Gold price attracts haven flows amid Middle East tensions
- The US-led forces continue to clash with the Iran-backed Houthi group in the Red Sea and seem to lend some support to the safe-haven Comex Gold price amid a subdued US Dollar price action.
- Houthi rebels in Yemen launched two anti-ship ballistic missiles at a US-owned, Greek-operated tanker ship on Thursday and the US, in response, carried out its fifth strike against Houthi targets.
- Pakistan undertook a series of military strikes against terrorist hideouts in the Sistan-Baluchistan province of Iran, while the latter began a planned air defense drill from its port of Chabahar near Pakistan.
- The USD consolidates below its highest level since December 13 touched earlier this week, though reduced bets for a March rate cut by the Federal Reserve continue to act as a tailwind.
- The incoming resilient US macro data released this week suggested that the economy is in good shape and gives the central bank headroom to keep interest rates higher for longer.
- Against the backdrop of the upbeat US Retail Sales figures on Wednesday, data released on Thursday showed that the Initial Jobless Claims fell to the lowest level since September 2022.
- The markets were quick to react to the strong labor-market report and are now pricing just over a 50% chance of a rate cut at the March FOMC meeting, down from 75% a week ago.
- The yield on the benchmark 10-year US government bond touched its highest level since mid-December, which favours the USD bulls and should cap gains for the non-yielding yellow metal.
- Traders now look to the US macro data – the Preliminary Michigan Consumer Sentiment and Inflation Expectations, along with Existing Home Sales – for short-term opportunities.
(An automation tool was used in creating this post.)
Gold FAQs
Why do people invest in Gold?
Gold has played a key role in human’s history as it has been widely used as a store of value and medium of exchange. Currently, apart from its shine and usage for jewelry, the precious metal is widely seen as a safe-haven asset, meaning that it is considered a good investment during turbulent times. Gold is also widely seen as a hedge against inflation and against depreciating currencies as it doesn’t rely on any specific issuer or government.
Who buys the most Gold?
Central banks are the biggest Gold holders. In their aim to support their currencies in turbulent times, central banks tend to diversify their reserves and buy Gold to improve the perceived strength of the economy and the currency. High Gold reserves can be a source of trust for a country’s solvency. Central banks added 1,136 tonnes of Gold worth around $70 billion to their reserves in 2022, according to data from the World Gold Council. This is the highest yearly purchase since records began. Central banks from emerging economies such as China, India and Turkey are quickly increasing their Gold reserves.
How is Gold correlated with other assets?
Gold has an inverse correlation with the US Dollar and US Treasuries, which are both major reserve and safe-haven assets. When the Dollar depreciates, Gold tends to rise, enabling investors and central banks to diversify their assets in turbulent times. Gold is also inversely correlated with risk assets. A rally in the stock market tends to weaken Gold price, while sell-offs in riskier markets tend to favor the precious metal.
What does the price of Gold depend on?
The price can move due to a wide range of factors. Geopolitical instability or fears of a deep recession can quickly make Gold price escalate due to its safe-haven status. As a yield-less asset, Gold tends to rise with lower interest rates, while higher cost of money usually weighs down on the yellow metal. Still, most moves depend on how the US Dollar (USD) behaves as the asset is priced in dollars (XAU/USD). A strong Dollar tends to keep the price of Gold controlled, whereas a weaker Dollar is likely to push Gold prices up.
Kiwi is back on struggle street after more strong US data, which is giving the US Dollar (USD) a boost. Economists at ANZ Bank analyze the NZD/USD outlook.
Expect volatility
The Kiwi has struggled in the face of a US Dollar rebound, but with a similar re-pricing underway locally (as markets stick to pricing in cuts, but later), it’s difficult to be overly bearish at current levels.
Data is likely to drive further volatility, but we continue to expect a gradual appreciation over 2024.
- Christine Lagarde will speak again on Friday at the World Economic Forum in Davos.
- ECB President is unlikely to mention monetary policy in her panel discussion.
- European Central Bank held rates for the second straight meeting in December.
Christine Lagarde, President of the European Central Bank (ECB), is set to speak on Friday at 10:00 GMT at the World Economic Forum (WEF) in Davos. It will be the last of her three appearances at the WEF Annual Meeting this week.
Having spoken on the "How to Trust Economics" panel on Wednesday and "Uniting Europe's Markets" on Thursday, ECB President Lagarde will participate in a panel discussion on "The Global Economic Outlook".
Friday’s debate will offer views on how policymakers would balance the need for action on growth and inflation by implementing the right tools while ensuring sustained and long-term economic growth. Lagarde’s comments will be closely scrutinized for any hints on the Euro area growth and inflation outlook, which could have a significant impact on policy-making.
However, she is unlikely to mention monetary policy during her commentary on the economic outlook, as the ECB has entered its “blackout period” ahead of next week’s policy meeting.
On Wednesday, Lagarde spoke in a Bloomberg interview on the sidelines of the WEF Annual Meeting in Davos, noting that “it is likely that we will cut rates by the summer.”
Christine Lagarde’s remarks prompted markets to dial back early rate cut expectations. ECB policymakers have continued to push back against aggressive rate cut expectations, suggesting that the central bank will remain data-dependent on its interest rate outlook.
The European Central Bank held rates for the second meeting in a row in December, as it revised down its growth and inflation forecasts. “The Governing Council’s future decisions will ensure that its policy rates will be set at sufficiently restrictive levels for as long as necessary,” the ECB said in its accompanying statement.
About Christine Lagarde
Christine Lagarde was born in 1956 in Paris, France. Graduated from Paris West University Nanterre La Défense and became President of the European Central Bank on November 1st 2019. Prior to that, she served as Chairman and Managing Director of the International Monetary Fund between 2011 and 2019. Lagarde previously held various senior ministerial posts in the Government of France: she was Minister of the Economy, Finance and Industry (2007–2011), Minister of Agriculture and Fishing (2007) and Minister of Commerce (2005–2007).
Euro price today
The table below shows the percentage change of Euro (EUR) against listed major currencies today. Euro was the strongest against the Pound Sterling.
| USD | EUR | GBP | CAD | AUD | JPY | NZD | CHF | |
| USD | 0.09% | 0.27% | 0.03% | 0.08% | 0.13% | 0.26% | 0.09% | |
| EUR | -0.09% | 0.18% | -0.05% | -0.02% | 0.04% | 0.17% | 0.00% | |
| GBP | -0.31% | -0.22% | -0.28% | -0.24% | -0.18% | -0.05% | -0.22% | |
| CAD | -0.03% | 0.06% | 0.24% | 0.02% | 0.09% | 0.23% | 0.05% | |
| AUD | -0.06% | 0.05% | 0.28% | -0.03% | 0.07% | 0.22% | 0.07% | |
| JPY | -0.13% | -0.06% | 0.16% | -0.10% | -0.08% | 0.18% | -0.04% | |
| NZD | -0.26% | -0.22% | 0.03% | -0.28% | -0.24% | -0.12% | -0.18% | |
| CHF | -0.08% | 0.04% | 0.18% | -0.05% | -0.02% | 0.07% | 0.16% |
The heat map shows percentage changes of major currencies against each other. The base currency is picked from the left column, while the quote currency is picked from the top row. For example, if you pick the Euro from the left column and move along the horizontal line to the Japanese Yen, the percentage change displayed in the box will represent EUR (base)/JPY (quote).
ECB FAQs
What is the ECB and how does it influence the Euro?
The European Central Bank (ECB) in Frankfurt, Germany, is the reserve bank for the Eurozone. The ECB sets interest rates and manages monetary policy for the region.
The ECB primary mandate is to maintain price stability, which means keeping inflation at around 2%. Its primary tool for achieving this is by raising or lowering interest rates. Relatively high interest rates will usually result in a stronger Euro and vice versa.
The ECB Governing Council makes monetary policy decisions at meetings held eight times a year. Decisions are made by heads of the Eurozone national banks and six permanent members, including the President of the ECB, Christine Lagarde.
What is Quantitative Easing (QE) and how does it affect the Euro?
In extreme situations, the European Central Bank can enact a policy tool called Quantitative Easing. QE is the process by which the ECB prints Euros and uses them to buy assets – usually government or corporate bonds – from banks and other financial institutions. QE usually results in a weaker Euro.
QE is a last resort when simply lowering interest rates is unlikely to achieve the objective of price stability. The ECB used it during the Great Financial Crisis in 2009-11, in 2015 when inflation remained stubbornly low, as well as during the covid pandemic.
What is Quantitative tightening (QT) and how does it affect the Euro?
Quantitative tightening (QT) is the reverse of QE. It is undertaken after QE when an economic recovery is underway and inflation starts rising. Whilst in QE the European Central Bank (ECB) purchases government and corporate bonds from financial institutions to provide them with liquidity, in QT the ECB stops buying more bonds, and stops reinvesting the principal maturing on the bonds it already holds. It is usually positive (or bullish) for the Euro.
- NZD/USD moves on a downward trajectory after softer Business NZ PMI data.
- A breach below 0.6100 could lead the pair to retest January’s low at 0.6088.
- The seven-day EMA at 0.6150 could act as an obstacle followed by the 23.6% Fibonacci retracement level at 0.6165.
NZD/USD continues its losing streak for the fifth straight session, trading lower near 0.6110 during the European session on Friday. The Business NZ Performance of Manufacturing Index (PMI) disclosed a decline in business activity within New Zealand's manufacturing sector, registering a figure of 43.1 in December compared to the previous reading of 46.5. This softer-than-expected result exerted downward pressure on the New Zealand Dollar (NZD), subsequently impacting the NZD/USD pair.
The technical analysis for the NZD/USD pair suggests a bearish sentiment in the market with the placement of the Moving Average Convergence Divergence (MACD) line below the centreline and exhibiting divergence below the signal line.
Additionally, the lagging indicator 14-day Relative Strength Index (RSI), is positioned below the 50 level, which signals a confirmation of the weaker momentum for the NZD/USD pair.
The NZD/USD pair finds immediate support at the psychological level at 0.6100. A firm break below the latter could put downward pressure on the pair to revisit January’s low at 0.6088 followed by the major support at 0.6050 level.
On the upside, the seven-day Exponential Moving Average (EMA) at 0.6150 could act as the key barrier for the NZD/USD pair. If the pair surpasses the seven-day EMA, it could provide support to underpinning the NZD/USD pair to explore the region around 23.6% Fibonacci retracement level at 0.6165 followed by the psychological resistance level at 0.6200.
NZD/USD: Daily Chart:
FX option expiries for Jan 19 NY cut at 10:00 Eastern Time, via DTCC, can be found below.
- EUR/USD: EUR amounts
- 1.0800 2.5b
- 1.0850 1.1b
- GBP/USD: GBP amounts
- 1.2650 1.4b
- USD/JPY: USD amounts
- 145.70 881m
- 146.00 1.1b
- 148.00 894m
- AUD/USD: AUD amounts
- 0.6600 835m
- USD/CAD: USD amounts
- 1.3200 845m
- 1.3335 1.9m
The Pound Sterling (GBP) was able to benefit this week from the higher-than-expected inflation data. Economists at Commerzbank analyze GBP outlook.
Further data publications worth a look
Concerns that the disinflation process could stall are likely to have increased as a result of the latest inflation publication. And the market is likely to be betting that the BoE will react appropriately and therefore be more cautious about the first interest rate cuts.
It is still worth taking a look at today's retail sales and next week's purchasing managers' indices. This is because the BoE is concerned that the tightening of monetary policy to date could stifle the economy too much. However, the economy has so far proved to be more robust than initially feared.
If the upcoming economic data paints a similar picture, the BoE will probably feel more comfortable waiting a little longer before cutting interest rates, which in turn would be positive for the Pound.
- Pound Sterling drops sharply as the UK Retail Sales contracted significantly in December.
- A deepening cost-of-living crisis forced households to cut spending despite the festive season.
- The BoE may continue to reiterate the need for higher interest rates for longer.
The Pound Sterling (GBP) falls sharply as the United Kingdom Office of National Statistics (ONS) reports downbeat Retail Sales data for December. UK household spending contracted significantly as individuals faced the heavy burden of higher interest rates and consumer price inflation, which deepened the cost-of-living crisis. A sharp decline in high street sales would have been expected to ease pressure on the stubbornly high inflation outlook but in the end it was insufficient to move the needle.
A significant contraction in the Retail Sales could have increased the odds of an early rate cut by the Bank of England (BoE). In spite of a significant fall in the UK consumer spending, however, BoE policymakers are expected to maintain a restrictive monetary policy stance until they are convinced that the underlying inflation will return to a 2% target in a timely and sustainable manner.
Going forward, market participants will shift their focus towards preliminary S&P Global PMI data for January, which will be released next week. The UK Manufacturing PMI has been contracting for more than a year and is expected to continue on the backfoot.
Daily Digest Market Movers: Pound Sterling falls sharply on dismal UK consumer spending data
- Pound Sterling faces an intense sell-off as the ONS reports a sharp decline in the Retail Sales data for December.
- Retail Sales excluding fuel prices was down sharply by 3.3% against expectations of a 0.6% fall. The economic data rose by 1.5% in November. On an annual basis, consumer spending (ex fuel) surprisingly contracted 2.1% versus. consensus of a 1.3% increase.
- Monthly sales at retail stores contracted sharply by 3.2% after expanding 1.4% in November. Investors anticipated a slower decline of 0.5%. Annually, consumer spending shrank surprisingly by 2.4% while investors projected a growth of 1.1%. In November, the economic data was slightly increased by 0.2%.
- The downbeat Retail Sales data is expected to ease the sticky inflation outlook.
- This is expected to provide a temporary relief to Bank of England (BoE) policymakers, which got worried about upside risks to price pressures after the release of the stubbornly higher inflation data for December.
- However, the stress of deepening recession fears due to a vulnerable economic outlook will keep BoE policymakers on their toes.
- It would be a balancing act for BoE policymakers to decide whether to turn dovish to safeguard the economy from recession or to maintain a restrictive monetary policy for bringing inflation down towards 2%.
- Meanwhile, investment banking firm Goldman Sachs is anticipating that the BoE will start reducing interest rates from August this year. The brokerage house now expects that interest rates will be reduced by 75 basis-points (bps) by the end of 2024.
- The market mood is quiet amid an absence of US front-line economic indicators. Meanwhile, market participants will focus on the speech from San Francisco Mary Daly.
- Fed Daly is expected to deliver a hawkish guidance on interest rates until policymakers get convinced that inflation will return to 2% in a timely manner.
- On Thursday, Federal Reserve Bank of Atlanta President Raphael Bostic said that rate cuts should only be undertaken if the central bank gets evidence indicating that inflation will return to the 2% target on a sustainable basis.
- Bostic warned that premature rate cuts could boost price pressures and impair efforts made to date to curtail higher inflation.
Technical Analysis: Pound Sterling faces pressure near 1.2700
Pound Sterling drops sharply after facing selling pressure near the round-level resistance of 1.2700. The near-term appeal for the GBP/USD pair is not bullish anymore as it is failing to climb above the 20-day Exponential Moving Average (EMA), which trades around 1.2690. While the 50-day EMA continues to provide support to the Pound Sterling bulls.
The 14-period Relative Strength Index (RSI) trades inside the 40.00-60.00 range, indicating a consolidation ahead amid absence of a potential economic trigger.
Pound Sterling FAQs
What is the Pound Sterling?
The Pound Sterling (GBP) is the oldest currency in the world (886 AD) and the official currency of the United Kingdom. It is the fourth most traded unit for foreign exchange (FX) in the world, accounting for 12% of all transactions, averaging $630 billion a day, according to 2022 data.
Its key trading pairs are GBP/USD, aka ‘Cable’, which accounts for 11% of FX, GBP/JPY, or the ‘Dragon’ as it is known by traders (3%), and EUR/GBP (2%). The Pound Sterling is issued by the Bank of England (BoE).
How do the decisions of the Bank of England impact on the Pound Sterling?
The single most important factor influencing the value of the Pound Sterling is monetary policy decided by the Bank of England. The BoE bases its decisions on whether it has achieved its primary goal of “price stability” – a steady inflation rate of around 2%. Its primary tool for achieving this is the adjustment of interest rates.
When inflation is too high, the BoE will try to rein it in by raising interest rates, making it more expensive for people and businesses to access credit. This is generally positive for GBP, as higher interest rates make the UK a more attractive place for global investors to park their money.
When inflation falls too low it is a sign economic growth is slowing. In this scenario, the BoE will consider lowering interest rates to cheapen credit so businesses will borrow more to invest in growth-generating projects.
How does economic data influence the value of the Pound?
Data releases gauge the health of the economy and can impact the value of the Pound Sterling. Indicators such as GDP, Manufacturing and Services PMIs, and employment can all influence the direction of the GBP.
A strong economy is good for Sterling. Not only does it attract more foreign investment but it may encourage the BoE to put up interest rates, which will directly strengthen GBP. Otherwise, if economic data is weak, the Pound Sterling is likely to fall.
How does the Trade Balance impact the Pound?
Another significant data release for the Pound Sterling is the Trade Balance. This indicator measures the difference between what a country earns from its exports and what it spends on imports over a given period.
If a country produces highly sought-after exports, its currency will benefit purely from the extra demand created from foreign buyers seeking to purchase these goods. Therefore, a positive net Trade Balance strengthens a currency and vice versa for a negative balance.
The focus of the FX market is starting to turn to the upcoming meetings of the ECB next Thursday and the Fed the following week. Economists at Commerzbank analyze what the FX market can expect from the meetings.
ECB will be cautious when it comes to the first interest rate cuts
It seems most plausible that the ECB will be cautious when it comes to the first interest rate cuts. Even if it is unlikely to deny that interest rates could fall over the course of the year, it will probably try to dampen premature expectations. Of course, it remains to be seen whether it will succeed.
There are no more data heavyweights due before the meeting. In the run-up to the meeting, the FX market is likely to be reluctant to trade the EUR lower.
- USD/CAD moves sideways with a positive bias toward an upward direction.
- US Dollar could continue its winning streak on the back of US bond yields.
- Higher Crude prices contribute to limiting the losses of the Canadian Dollar.
USD/CAD attempts to retrace its recent losses, trading around 1.3490 during the early European hours on Friday. The US Dollar (USD) continues to move in an upward direction on the back of solid economic data from the United States (US), coupled with the higher US Treasury yields.
The US Dollar Index (DXY) trades around 103.40 with the 2-year and 10-year yields on US bond coupons standing at 4.35% and 4.15%, respectively, by the press time. The monthly US Housing Starts outperformed expectations in December, reaching 1.46M against the anticipated 1.426M. Building Permits (MoM) also reported growth, increasing to 1.495M and surpassing the market consensus of 1.48M. Furthermore, Initial Jobless Claims for the week ending on January 12 decreased to 187K from the previous reading of 203K.
On the other side, the Canadian Dollar (CAD) received some support from the higher Crude oil prices, given that Canada is the largest oil exporter to the United States (US). West Texas Intermediate (WTI) price grapples to extend its gains for the third consecutive day, hovering around $73.90 per barrel at the time of writing. The Crude oil prices cheer the decline in the Crude Oil stockpiles.
US Energy Information Administration (EIA) revealed the weekly measure for the week ending on January 12. US Crude Oil Stocks Change fell by 2.492M barrels against the expected decline of 0.323M barrels, swinging from the previous stockpiles of 1.338M barrels.
On Friday, economic data includes Canada's Retail Sales for November, offering insights into consumer spending trends in the country. Concurrently, the United States will release the Michigan Consumer Sentiment Index for January, indicating consumer confidence in the economic outlook. Apart from economic indicators, market participants will also pay attention to speeches from central bank officials. These speeches can provide additional context and insights into the trajectory of monetary policies.
Here is what you need to know on Friday, January 19:
The tech rally-led risk-on sentiment on Wall Street failed to extend in Asian trading on Friday, as the Middle East geopolitical tensions heated up alongside persistent Chinese economic worries. The US Dollar eased, despite a cautious market mood, as investors weighed the US Federal Reserve’s (Fed) rate cut outlook.
Fresh reports hit the wires earlier this morning that Iran-backed Houthi terrorists launched two anti-ship ballistic missiles at M/V Chem Ranger, a Marshall Island-flagged, US-Owned, Greek-operated tanker ship. This comes after the United States (US) launched new strikes against Houthi anti-ship missiles aimed at the Red Sea on Thursday.
On Thursday, the US weekly Initial Jobless Claims fell to their lowest level in nearly 1-1/2 years, suggesting tighter labor market conditions and tempering the odds for a March Fed rate cut. The probability for a March Fed rate cut is now below 60%, the CME Group’s FedWatch Tool showed, as against a roughly 75% chance seen at the start of the week.
The US Treasury bond yields hit fresh multi-week highs on strong US data and hawkish Fedspeak, which continued to push back against the market’s expectations of a rate cut as early as March. Atlanta Fed President Raphael Bostic said on Thursday that the “baseline is for rate reductions sometime in Q3, but care is needed to not to cut soon or risk a refreshed price spiral.”
At the time of writing, the US Dollar Index is down 0.09% on the day at 103.45 while the benchmark 10-year US Treasury bond yields are rising 0.75% so far to refresh five-week highs near 4.18%.
US Dollar price this week
The table below shows the percentage change of US Dollar (USD) against listed major currencies this week. US Dollar was the strongest against the Japanese Yen.
| USD | EUR | GBP | CAD | AUD | JPY | NZD | CHF | |
| USD | 0.60% | 0.38% | 0.58% | 1.64% | 2.17% | 2.11% | 1.74% | |
| EUR | -0.61% | -0.22% | -0.03% | 1.05% | 1.58% | 1.52% | 1.14% | |
| GBP | -0.40% | 0.21% | 0.18% | 1.25% | 1.78% | 1.74% | 1.35% | |
| CAD | -0.58% | 0.03% | -0.18% | 1.06% | 1.60% | 1.54% | 1.16% | |
| AUD | -1.67% | -1.05% | -1.25% | -1.06% | 0.54% | 0.48% | 0.12% | |
| JPY | -2.22% | -1.60% | -1.94% | -1.63% | -0.54% | -0.06% | -0.44% | |
| NZD | -2.16% | -1.55% | -1.77% | -1.58% | -0.49% | 0.05% | -0.39% | |
| CHF | -1.76% | -1.15% | -1.37% | -1.18% | -0.09% | 0.45% | 0.39% |
The heat map shows percentage changes of major currencies against each other. The base currency is picked from the left column, while the quote currency is picked from the top row. For example, if you pick the Euro from the left column and move along the horizontal line to the Japanese Yen, the percentage change displayed in the box will represent EUR (base)/JPY (quote).
The next near-term direction in the US Dollar will be determined by the upcoming top-tier US UoM Consumer Sentiment data and Fedspeak. The Fed begins its ‘blackout period’ on Saturday ahead of the January 31- February 1 policy meeting. Additionally, the end-of-the-week flows and the repositioning ahead of next week’s fourth-quarter GDP report from the US will play a pivotal role.
Across the FX board, AUD/USD is trading neutral near 0.6570 after testing 0.6600 on a firmer Chinese Yuan. NZD/USD is posting sizeable losses to trade below 0.6100 after New Zealand's Business Performance of Manufacturing Index (PMI) contracted further to 43.1 in December, down from November's 46.7.
USD/JPY is sitting close to multi-month highs of 148.81, as soft Japanese CPI data poured cold water on any expectations of hawkish policy hints from the Bank of Japan (BoJ) when they meet next week to decide on its policy.
EUR/USD is consolidating losses below 1.0900, somewhat supported by the ongoing pushback by the European Central Bank’s (ECB) policymakers against interest rate cuts and a broadly subdued US Dollar. ECB President Christine Lagarde’s speech in Davos on the Global Economic Outlook will be closely eyed.
GBP/USD is dropping toward 1.2650, undermined by the bigger-than-expected decline in UK Retail Sales. The UK Retail Sales fell 3.2% MoM in December vs. -0.5% expected and 1.4% booked in November, the official data published by the Office for National Statistics (ONS) showed on Friday.
USD/CAD is holding lower ground below 1.3500, as the WTI oil is sitting at fresh five-day highs of $74.20. The geopolitical developments between the US and the Iran-back Houthi rebels fuel supply disruption concerns, rendering positive for the black gold.
Chinese Yuan (CNY) likely to tread water in 2024, analysts at TD Securities say.
Onshore firms still rather sell the CNY and keep to USD
China's murky economic outlook isn't favourable for the Yuan and we expect the inflows registered over Nov/Dec to reverse.
Onshore firms still rather sell the yuan and hold USD despite USD weakness late last year and hints of their medium-term bearish view on the currency.
More pressure on the RMB is expected as outbound China travel picks up, evident from the jump in FX sales (services). As such, we don't expect USD/CNY to go below 7.0000 in 2024 despite our bearish USD view this year.
- GBP/JPY loses its recent gains around 188.25 following the downbeat UK Retail Sales data.
- UK Retail Sales fell 3.2% MoM in December from a 1.4% rise in November, below the market consensus
- The cross holds above the key EMA with the overbought RSI condition.
- The immediate resistance level will emerge at 189.00; 187.32 acts as an initial support level for EUR/JPY.
The GBP/JPY cross trades in positive territory for the fifth consecutive day during the early European session on Friday. However, the cross loses its recent gains and retreats from the intraday high of 188.93 after the release of weaker-than-expected UK Retail Sales data. The cross currently trades near 188.25, up 0.04% on the day.
The latest data from the National Statistics revealed on Friday that UK Retail Sales fell 3.2% MoM in December from a 1.4% rise in November, below the market consensus of a 0.5% drop. Retail Sales ex-fuel dropped 3.3% MoM in December from the previous reading of a 1.5% increase.
On an annual basis, UK Retail Sales came in at -2.4% YoY in December versus 0.2% prior, worse than the market expectation of a 1.1% rise. The Pound Sterling drops lower following the downbeat UK data.
From a technical perspective, GBP/JPY maintains the positive view unchanged on the four-hour chart as the cross holds above the 50- and 100-hour Exponential Moving Averages (EMAs). The 14-day Relative Strength Index (RSI) holds in bullish territory above the 50 midline. However, the overbought RSI condition indicates that further consolidation cannot be ruled out before positioning for any near-term GBP/JPY appreciation.
The psychological round mark at 189.00 acts as an immediate resistance level for the cross. Any follow-through buying above the latter will pave the way to the upper boundary of the Bollinger Band at 189.36. Further north, the next hurdle is seen near a weekly high of December 2014 at 189.72, followed by the 190.00 round figure.
On the flip side, a low of December 18 at 187.32 acts as an initial support level for EUR/JPY. The additional downside filter to watch is the 187.00 psychological mark, followed by the 50-hour EMA at 185.93. A breach of this level will see a drop to the lower limit of the Bollinger Band at 184.85. The key contention level will emerge at the 100-hour EMA at 184.65. A breach of the latter would likely resume the downtrend.
GBP/JPY four-hour chart
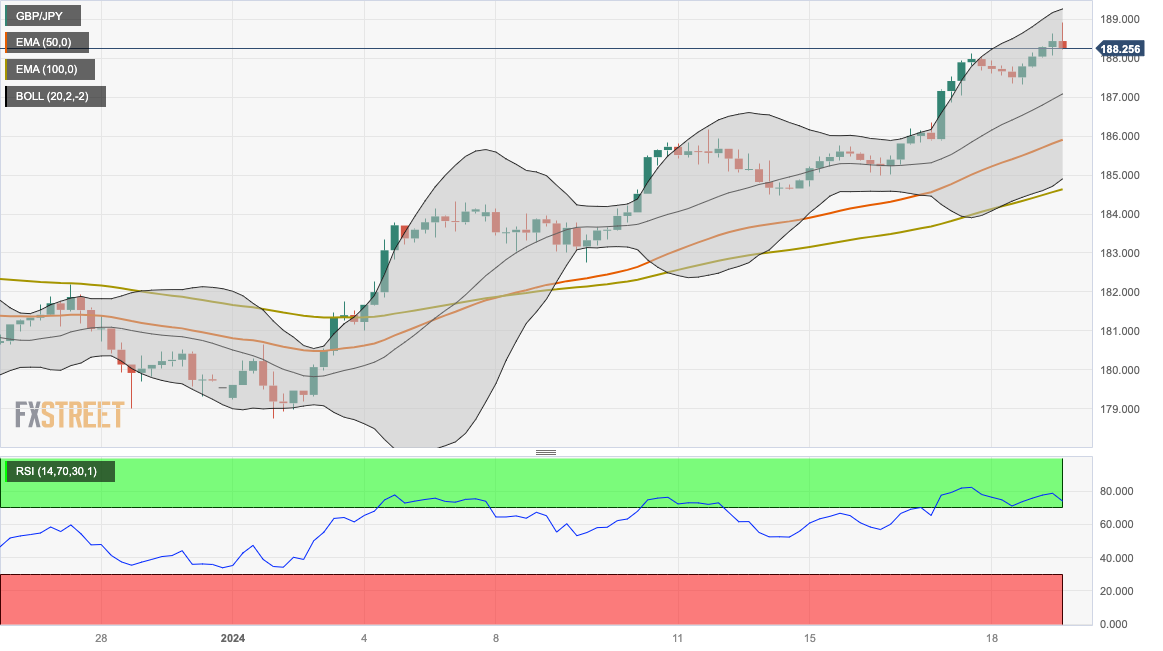
- The UK Retail Sales fell 3.2% MoM in December, a big miss.
- Core Retail Sales for the UK dropped 3.3% MoM in December.
- GBP/USD keeps the red below 1.2700 on downbeat UK data.
The UK Retail Sales tumbled 3.2% over the month in December vs. -0.5% expected and 1.4% booked in November, according to the official data published by the Office for National Statistics (ONS) on Friday.
The Core Retail Sales, stripping the auto motor fuel sales, dropped 3.3% MoM vs. -0.6% expected and 1.5% seen in November.
The annual Retail Sales in the United Kingdom declined 2.4% in December versus 1.1% expected and November’s 0.2% growth while the Core Retail Sales decreased by 2.1% in the reported month versus 1.3% expectations and 0.5% previous.
Main points (via ONS)
Retailers say part of fall reflects consumers purchasing food and Xmas gifts in December.
Retail sales likely to subtract 0.04 pct points from Q4 GDP.
Market reaction to UK Retail Sales report
GBP/USD is keeping its renewed downside intact near 1.2685 on the downbeat UK Retail Sales data. The spot is down 0.17% on the day.
Pound Sterling price today
The table below shows the percentage change of Pound Sterling (GBP) against listed major currencies today. Pound Sterling was the weakest against the Euro.
| USD | EUR | GBP | CAD | AUD | JPY | NZD | CHF | |
| USD | -0.01% | 0.22% | 0.05% | 0.11% | 0.28% | 0.40% | 0.03% | |
| EUR | 0.01% | 0.21% | 0.07% | 0.09% | 0.31% | 0.40% | 0.04% | |
| GBP | -0.22% | -0.22% | -0.15% | -0.12% | 0.08% | 0.18% | -0.18% | |
| CAD | -0.06% | -0.07% | 0.14% | 0.01% | 0.22% | 0.32% | -0.04% | |
| AUD | -0.10% | -0.10% | 0.15% | -0.05% | 0.18% | 0.30% | -0.07% | |
| JPY | -0.27% | -0.27% | -0.06% | -0.22% | -0.16% | 0.10% | -0.23% | |
| NZD | -0.36% | -0.38% | -0.13% | -0.31% | -0.26% | -0.07% | -0.33% | |
| CHF | 0.00% | 0.02% | 0.22% | 0.05% | 0.09% | 0.30% | 0.39% |
The heat map shows percentage changes of major currencies against each other. The base currency is picked from the left column, while the quote currency is picked from the top row. For example, if you pick the Euro from the left column and move along the horizontal line to the Japanese Yen, the percentage change displayed in the box will represent EUR (base)/JPY (quote).
- Silver price finds an interim support near $22.40 amid geopolitical tensions.
- The Fed is expected to maintain status-quo in January policy meeting for the fourth time in a row.
- Fed Bostic warns about upside risks of inflation on premature rate cuts.
Silver price (XAG/USD) recovers to near $22.70 as the US Dollar Index (DXY) struggles to extend recovery and Middle East tensions keep driving flows for safe-haven assets. The white metal bounced back from two-months low of $22.43 but is still incapable to convince investors that a solid recovery is on cards.
S&P500 futures remains flat in the Asian session, portraying a cautious market mood. The USD Index oscillates inside Thursday’s trading range amid absence of front-line economic indicators. 10-year US Treasury yields have climbed to near 4.17%.
Meanwhile, investors shift focus towards the Federal Reserve (Fed) monetary policy meeting, which will be announced on January 31. The Fed is widely anticipated to maintain interest rates unchanged in the range of 5.25-5.50%. Investors will keenly focus on the guidance on interest rates as when the Fed is considering its first rate-cut after a historically swift ‘rate-tightening’ campaign.
On Thursday, Atlanta Fed Bank President Raphael Bostic said rate-cuts can be announced sooner if the central bank has ‘convincing’ evidence that inflation will return to the 2% target in a timely manner. Bostic warned that premature rate cuts and boost overall demand and push price pressures higher, which can spoil efforts yet made to contain stubborn inflation.
Silver technical analysis
Silver price oscillates inside the Descending Triangle chart pattern on a daily scale, which indicates a sharp contraction in volatility. The asset hovers near the horizontal support of the aforementioned chart pattern, which is December 13 low of $22.50. The downward-sloping trendline of the volatility contraction pattern is plotted from December 3 high at $25.92.
The 20-period Exponential Moving Average (EMA) near $23.20 continues to act as a resistance for Silver price bulls.
The Relative Strength Index (RSI) (14) is at a make or a break level. A convincing stability in the 20.00-40.00 range will trigger a bearish momentum.
Silver daily chart
-638412417452221974.png)
- EUR/GBP attempts to recover the recent losses ahead of UK Retail Sales data.
- Hot UK inflation numbers influence traders to trim their expectations for BoE rate cuts.
- ECB President Lagarde’s indication on rate cuts weighs on the Euro.
EUR/GBP rebounds from January’s low at 0.8555 marked on Thursday. The EUR/GBP cross trades higher near 0.8570 during the Asian session on Friday. The Pound Sterling struggles ahead of the Retail Sales data from the United Kingdom (UK) scheduled to be released later in the day. The monthly Retail Sales data is expected to decline by 0.5%, swinging from the previous growth of 1.3%. While the year-over-year result could increase to 1.1% from 0.1% prior.
The upbeat UK inflation data released on Wednesday provided support for the British Pound (GBP), exerting downward pressure on the EUR/GBP cross. Concurrently, traders scaled back their expectations for Bank of England (BoE) rate cuts. The market, which previously priced in an 80% likelihood of 25 basis points cut by the BoE in May on Tuesday, has now adjusted those odds to 50%. This shift in expectations could offer additional support to the GBP while acting as a headwind for the EUR/GBP cross.
On the other side, the speculations about potential rate cuts by the European Central Bank (ECB) in September are contributing to the weakening of the Euro (EUR). Market sentiment received a lift when ECB President Christine Lagarde, speaking at the World Economic Forum (WEF) in Davos, indicated that interest rate cuts could be under consideration by the summer.
President Lagarde emphasized the potential peak in the ECB's interest rates and highlighted the central bank's dependence on economic data. She acknowledged the existence of ongoing uncertainties and indicators that are not yet firmly anchored, contributing to the nuanced stance on future monetary policy. Germany's Producer Price Index (PPI) data will be eyed on Friday.
- EUR/JPY surges to 161.55, the highest level since November 30, 2023.
- ECB President Christine Lagarde said interest rate cuts might be on the table by the summer.
- The decline in the Japanese CPI in December reaffirms expectations that the BoJ will maintain its ultra-dovish stance.
- Investors await the December German Producer Price Index (PPI) and the ECB's Lagarde speech on Friday.
The EUR/JPY cross gathers strength above the mid-161.00s during the early European session on Friday. The cross has reached the highest levels since November 30, 2023, following the release of Japanese inflation data, which might convince the Bank of Japan to maintain the status quo. At press time, EUR/JPY is trading at 161.72, up 0.41% on the day.
The European Central Bank (ECB) minutes released on Thursday showed that June would be the earliest they might know whether inflation had been controlled. The central bank was worried that market expectations for rate cuts as early as March had loosened financial conditions so much that they “could derail the disinflationary process."
ECB President Christine Lagarde hinted at possible rate cuts at the World Economic Forum in Davos on Thursday. Lagarde said that interest rate cuts might be on the table by the summer, but the central bank remains data-focused. Additionally, the ECB will closely watch the developments surrounding geopolitical tension in the Red Sea as it might impact goods inflation in the eurozone.
On the other hand, the escalating geopolitical tension in the Middle East might provide support to safe-haven assets like Japanese Yen (JPY) and cap the upside of the EUR/JPY cross.
Apart from this, the BoJ monetary policy meeting next week will be a crucial event and might trigger volatility in the market. The decline in the Japanese Consumer Price Index (CPI) in December reaffirms the market's expectations that the Bank of Japan (BoJ) will maintain its ultra-dovish stance at its monetary policy meeting next week. Early Friday, December Japan’s CPI arrived at 2.6% YoY versus 2.8% prior, while the National CPI ex Fresh Food came in at 2.3% YoY in December from the previous reading of 2.5%.
Looking ahead, the German Producer Price Index (PPI) for December will be released on Friday. Also, the ECB's President Lagarde speech is set to speak and might offer some hints about the further monetary policy path. Next week, attention will shift to the BoJ interest rate decision.
- USD/CHF continues to gain ground after nervous comments from the SNB Chairman.
- SNB Chairman Thomas Jordan is concerned that excessive appreciation of CHF could drive inflation below zero.
- US Dollar gained ground on the diminished possibility of Fed rate cuts in March.
USD/CHF seems to continue its winning streak that began on January 11. On Thursday, Swiss National Bank (SNB) Chairman Thomas Jordan issued a warning about the Swiss Franc's (CHF) appreciating trend. Jordan expressed concerns at the World Economic Forum (WEF) in Davos about its potential impact on the SNB's ability to maintain inflation above zero in the Swiss domestic economy. These remarks have contributed to the USD/CHF pair's upward trajectory, with trading slightly higher around 0.8680 during the Asian session on Friday.
As the Swiss Franc experienced rapid appreciation towards the end of 2023, the SNB is sounding the alarm, emphasizing that excessive appreciation could pose a threat to the Swiss economy. A strengthening CHF has the potential to drive inflation lower swiftly. Market participants await Swiss Producer and Import Prices to gain further impetus on consumer price inflation in Switzerland.
The US Dollar Index (DXY) remains steady after recent gains with a positive bias to continue its winning streak on the back of upbeat US Treasury yields. The DXY hovers around 103.40 with the 2-year and 10-year yields on US bond coupons standing at 4.36% and 4.16%, respectively, at the time of writing.
On Thursday, positive economic indicators from the United States (US) provided further support to the upward momentum of the US Dollar, diminishing the likelihood of early interest rate cuts by the Federal Reserve (Fed) in March. In addition to the economic data, Federal Reserve Bank of Atlanta President Raphael Bostic made statements on Thursday during an event at the Atlanta Chamber of Commerce. Bostic noted that the base case for the Fed is to consider rate cuts in the third quarter, but he also kept the possibility open for earlier initiation of the rate cut cycle, contingent on inflation figures.
Traders are anticipated to closely monitor the US preliminary Michigan Consumer Sentiment Index, with expectations of improvement in January, as it may provide further insights into the market sentiment and the potential trajectory of the Fed’s monetary policy.
- GBP/USD attracts some buyers for the third successive day amid subdued USD demand.
- The hotter UK CPI dashed hopes for an early rate cut by the BoE and underpins the GBP.
- The intraday technical setup favours bulls and supports prospects for a further move up.
The GBP/USD pair ticks higher for the third successive day on Friday and looks to build on this week's goodish bounce from sub-1.2600 levels, or its lowest level since December 13. Spot prices currently trade just above the 1.2700 round figure, flirting with the 200-hour Simple Moving Average (SMA).
Investors trimmed their bets for an early interest rate cut by the Bank of England (BoE) after the UK Office for National Statistics (ONS) reported on Wednesday that the Consumer Price Index (CPI) rose for the first time in 10 months. This continues to underpin the British Pound (GBP), which, along with subdued US Dollar (USD) price action, acts as a tailwind for the GBP/USD pair.
That said, diminishing odds for a more aggressive policy easing by the Federal Reserve leads to a further rise in the US Treasury bond yields higher and lend some support to the Greenback. This, in turn, holds back traders from placing aggressive directional bets around the GBP/USD pair and might cap any further gains ahead of the release of the UK monthly Retail Sales figures.
From a technical perspective, the recent failure to find acceptance below the 1.2600 round-figure mark and the subsequent move-up warrants caution for bearish traders. Moreover, oscillators on daily/hourly charts are holding in the positive territory. This suggests that the path of least resistance for the GBP/USD pair is to the upside and supports prospects for additional gains.
Hence, some follow-through strength towards testing a downward sloping trend-line resistance extending from the December swing high, currently around the 1.2760-1.2765 region, looks like a distinct possibility. The said barrier should act as a key pivotal point, which if cleared decisively might set the stage for a move towards reclaiming the 1.2800 round-figure mark.
On the flip side, any meaningful slide below the 1.2700 mark now seems to find decent support near the 1.2635-1.2630 region. This is closely followed by the 1.2600 round figure, which if broken decisively will be seen as a fresh trigger for bearish traders. The GBP/USD pair might then accelerate the fall towards the 200-day SMA support, currently pegged near mid-1.2500s.
GBP/USD 1-hour chart
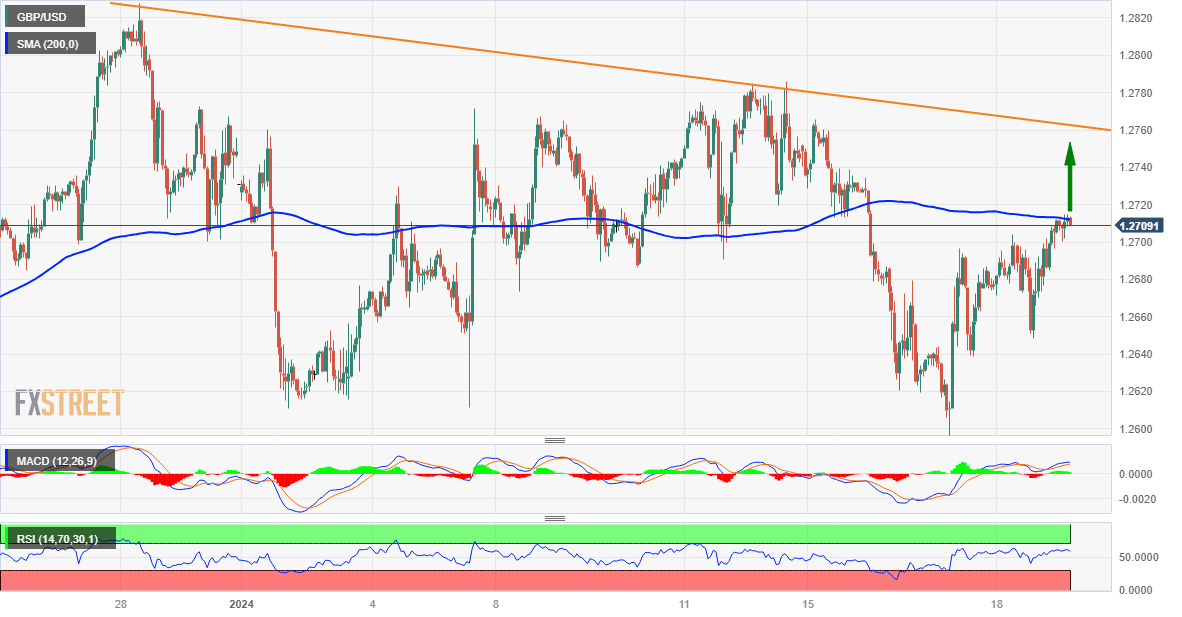
Technical levels to watch
- Gold price struggles to capitalize on the previous day’s recovery move from over a one-month trough.
- Reduced bets for a March Fed rate cut put upward pressure on the US bond yields and caps gains.
- Escalating geopolitical tensions underpin the safe-haven XAU/USD and should limit the downside.
Gold price (XAU/USD) oscillates in a narrow trading range during the Asian session on Friday and remains well within the striking distance of over a one-month trough, around the $2,000 psychological mark touched earlier this week. Geopolitical tensions in the Middle East escalated further after Pakistan launched retaliatory airstrikes inside Iran on Thursday. This comes on top of US-Houthi clashes in the Red Sea, which, along with persistent worries about sustained economic weakness in China, acts as a tailwind for the safe-haven precious metal.
Meanwhile, the US Dollar (USD) extends its sideways consolidative price move for the third successive day and turns out to be another factor lending support to the Gold price. That said, reduced bets for an early interest rate cut by the Federal Reserve (Fed) remain supportive of elevated US Treasury bond yields, which might continue to lend support to the USD and cap gains for the non-yielding yellow metal. This, in turn, warrants some caution for aggressive bullish traders and before positioning for any meaningful appreciating move for the XAU/USD.
Daily Digest Market Movers: Gold price struggles to attract buyers amid mixed fundamental cues
- The US-led forces continue to clash with the Iran-backed Houthi group in the Red Sea and seem to benefit the safe-haven Gold price amid a subdued range-bound price action around the US Dollar.
- Houthi rebels in Yemen launched two anti-ship ballistic missiles at a US-owned, Greek-operated tanker ship on Thursday and the US, in response, carried out its fifth strike against Houthi targets.
- Pakistan undertook a series of military strikes against terrorist hideouts in the Sistan-Baluchistan province of Iran, while the latter began a planned air defense drill from its port of Chabahar near Pakistan.
- The USD consolidates below its highest level since December 13 touched earlier this week, though reduced bets for a March rate cut by the Federal Reserve continue to act as a tailwind.
- The incoming resilient US macro data released this week suggested that the economy is in good shape and gives the central bank headroom to keep interest rates higher for longer.
- Against the backdrop of the upbeat US Retail Sales figures on Wednesday, data released on Thursday showed that the Initial Jobless Claims fell to the lowest level since September 2022.
- The markets were quick to react to the strong labor-market report and are now pricing just over a 50% chance of a rate cut at the March FOMC meeting, down from 75% a week ago.
- The yield on the benchmark 10-year US government bond touched its highest level since mid-December, which favours the USD bulls and should cap gains for the non-yielding yellow metal.
- Traders now look to the US macro data – the Preliminary Michigan Consumer Sentiment and Inflation Expectations, along with Existing Home Sales – for short-term opportunities.
Technical Analysis: Gold price bears might wait for a break below $2,000 before placing fresh bets
From a technical perspective, the lack of follow-through buying beyond the 50-day Simple Moving Average (SMA) suggests that the selling bias is still far from being over. Furthermore, oscillators on the daily chart have just started gaining negative traction and suggest that the path of least resistance for the Gold price is to the downside. Hence, any further move up might still be seen as an opportunity for bearish traders and runs the risk of fizzling out rather quickly near the $2,040-2,042 static resistance. Some follow-through buying, however, might trigger a short-covering rally and lift the XAU/USD towards the $2,077 area en route to the $2,100 psychological mark.
On the flip side, bearish traders might now wait for a sustained break below the $2,000 round figure before placing fresh bets. The Gold price might then accelerate the downfall towards the December monthly swing low, around the $1,974-1,973 region. The latter near the 100- and 200-day SMAs confluence, around the $1,971-1,963 area, which if broken decisively should pave the way for deeper losses towards the $1,955 intermediate support. The XAU/USD could eventually drop to the November swing low, around the $1,932-1,931 region.
US Dollar price today
The table below shows the percentage change of US Dollar (USD) against listed major currencies today. US Dollar was the weakest against the Euro.
| USD | EUR | GBP | CAD | AUD | JPY | NZD | CHF | |
| USD | -0.09% | -0.02% | 0.00% | -0.02% | 0.07% | 0.25% | 0.00% | |
| EUR | 0.09% | 0.07% | 0.08% | 0.05% | 0.16% | 0.32% | 0.09% | |
| GBP | 0.02% | -0.06% | 0.02% | -0.01% | 0.08% | 0.28% | 0.03% | |
| CAD | 0.00% | -0.09% | -0.02% | -0.05% | 0.07% | 0.26% | 0.00% | |
| AUD | 0.04% | -0.03% | 0.03% | 0.04% | 0.10% | 0.29% | 0.04% | |
| JPY | -0.07% | -0.15% | -0.08% | -0.08% | -0.10% | 0.19% | -0.07% | |
| NZD | -0.27% | -0.36% | -0.27% | -0.28% | -0.31% | -0.19% | -0.27% | |
| CHF | 0.00% | -0.06% | -0.02% | 0.00% | -0.07% | 0.09% | 0.23% |
The heat map shows percentage changes of major currencies against each other. The base currency is picked from the left column, while the quote currency is picked from the top row. For example, if you pick the Euro from the left column and move along the horizontal line to the Japanese Yen, the percentage change displayed in the box will represent EUR (base)/JPY (quote).
Gold FAQs
Why do people invest in Gold?
Gold has played a key role in human’s history as it has been widely used as a store of value and medium of exchange. Currently, apart from its shine and usage for jewelry, the precious metal is widely seen as a safe-haven asset, meaning that it is considered a good investment during turbulent times. Gold is also widely seen as a hedge against inflation and against depreciating currencies as it doesn’t rely on any specific issuer or government.
Who buys the most Gold?
Central banks are the biggest Gold holders. In their aim to support their currencies in turbulent times, central banks tend to diversify their reserves and buy Gold to improve the perceived strength of the economy and the currency. High Gold reserves can be a source of trust for a country’s solvency. Central banks added 1,136 tonnes of Gold worth around $70 billion to their reserves in 2022, according to data from the World Gold Council. This is the highest yearly purchase since records began. Central banks from emerging economies such as China, India and Turkey are quickly increasing their Gold reserves.
How is Gold correlated with other assets?
Gold has an inverse correlation with the US Dollar and US Treasuries, which are both major reserve and safe-haven assets. When the Dollar depreciates, Gold tends to rise, enabling investors and central banks to diversify their assets in turbulent times. Gold is also inversely correlated with risk assets. A rally in the stock market tends to weaken Gold price, while sell-offs in riskier markets tend to favor the precious metal.
What does the price of Gold depend on?
The price can move due to a wide range of factors. Geopolitical instability or fears of a deep recession can quickly make Gold price escalate due to its safe-haven status. As a yield-less asset, Gold tends to rise with lower interest rates, while higher cost of money usually weighs down on the yellow metal. Still, most moves depend on how the US Dollar (USD) behaves as the asset is priced in dollars (XAU/USD). A strong Dollar tends to keep the price of Gold controlled, whereas a weaker Dollar is likely to push Gold prices up.
- EUR/USD could face a challenge on the sentiment toward early rate cuts by the ECB.
- ECB President Christine Lagarde expects interest rate cuts might be considered by the summer.
- Upbeat US Treasury yields could reinforce the strength of the US Dollar.
EUR/USD moves upward, recovering its recent losses registered in the previous session. The EUR/USD pair trades higher around 1.0890 during the Asian trading hours on Friday. However, the Euro (EUR) could confront a challenge arising from speculations regarding potential rate cuts by the European Central Bank (ECB) in September. The prevailing sentiment was boosted when ECB President Christine Lagarde, speaking at the World Economic Forum (WEF) in Davos, suggested that interest rate cuts might be considered by the summer.
President Lagarde highlighted the possibility that the ECB's interest rates have peaked and underscored the central bank's reliance on economic data. She acknowledged the presence of ongoing uncertainties and indicators that are still not firmly anchored, contributing to the nuanced stance on future monetary policy.
The US Dollar Index (DXY) remains steady after recent gains with a positive bias to continue its winning streak. The upward movement in US Treasury yields could provide support to underpinning the US Dollar. The 2-year and 10-year yields on US bond coupons stand at 4.36% and 4.16%, respectively, at the time of writing. On Thursday, US hot figures provided further impetus to the upward bias in the US Dollar, undermining the early interest rate cuts by the US Federal Reserve (Fed) in March.
US Housing Starts (MoM) outperformed expectations in December, reaching 1.46 million compared to the anticipated 1.426 million. Building Permits for the month also exhibited growth, climbing to 1.495 million and surpassing the market consensus of 1.48 million. Furthermore, Initial Jobless Claims for the week ending on January 12 decreased to 187,000 from the previous reading of 203,000.
Traders are anticipated to closely monitor the Germany's Producer Price Index (PPI) data on Friday. Conversely, attention will be directed towards the US preliminary Michigan Consumer Sentiment Index for January, expecting an improvement to a reading of 70 from December's figure of 69.7 for additional market insights.
- Indian Rupee holds positive ground on the modest decline in the USD.
- RBI’s Das said that it’s too early to talk about rate cuts until the 4% inflation target is achieved on a sustained basis.
- Investors will monitor the preliminary US Michigan Consumer Sentiment Index for January for fresh impetus.
Indian Rupee (INR) gains traction on Friday amid a modest decline in the US Dollar (USD). However, the INR’s upside might be capped due to the rise in US Treasury bond yields after the upbeat US economic data. Furthermore, the rebound in oil prices amid the geopolitical tension in the Red Sea might also weigh on the Indian Rupee as the country is the third largest consumer of crude oil in the world.
Reserve Bank of India (RBI) Governor Shaktikanta Das said on Thursday in Davos that it would be premature to talk about cuts in the key policy rate until the inflation target is achieved on a durable basis. When asked whether a rate cut was possible in the second half of 2024, RBI’s Das said that average inflation is estimated to reach 4.5% in fiscal years 2024–25 and it would depend on many factors. He further stated that the central bank’s focus is to remain actively disinflationary and lower CPI inflation to 4% on a sustained basis.
Later on Friday, the preliminary US Michigan Consumer Sentiment Index and Existing Home Sales will be due. FOMC members M. Daly (San Francisco) and M. Barr (Board of Governors) are scheduled to deliver speeches. The stronger-than-expected US economic data, along with Fed officials pushing back on rate expectations, could exert some selling pressure on the Indian Rupee.
Daily Digest Market Movers: Indian Rupee seems vulnerable amid multiple headwinds
- India is estimated to grow by at least 7% in 2024–25, higher than what the RBI forecast in December, according to the Reserve Bank of India's (RBI) January bulletin.
- The RBI's Bulletin highlights the shift from consumption to investment as a key factor driving India's economic growth.
- Das said that Consumer Price Index (CPI) inflation has decreased from a peak of 7.8% amid the Ukraine-Russia conflict to within the RBI's target range of 2–6%.
- The US weekly Initial Jobless Claims fell to 187K for the week ended January 13 from the previous reading of 203K, stronger than the market expectation of 207K.
- The total for continuing claims hit 1.806 million, better than the 1.845 million expected.
- The Philadelphia Fed Manufacturing Survey improved to -10.6 in January from -12.8 in December.
- Atlanta Federal Reserve (Fed) President Raphael Bostic anticipates that policymakers will start cutting interest rates in the third quarter of this year, as inflation is approaching the central bank’s target.
- The Fed Funds futures market is pricing in 57% odds of the first rate cuts as early as March, according to the CME FedWatch tool.
Technical Analysis: Indian Rupee keeps trading range-bound between 82.80 and 83.40
Indian Rupee trades firmly on the day. The USD/INR pair remains traded in a familiar multi-month-old trading band between 82.80 and 83.40. USD/INR holds above the key 100-period Exponential Moving Average (EMA) on the daily chart. However, the 14-day Relative Strength Index (RSI) hovers around the 50.0 midline, indicating directionless in the near term.
The first upside barrier will emerge near the upper boundary of the trading range at 83.40. Any follow-through buying will pave the way to a 2023 high of 83.47, followed by the 84.00 round figure. On the flip side, the initial support level is seen at the 83.00 psychological mark. A decisive break below 83.00 will expose 82.80 (the lower limit of the trading range, low of January 15), and finally at 82.60 (low of August 11).
US Dollar price today
The table below shows the percentage change of US Dollar (USD) against listed major currencies today. US Dollar was the weakest against the Euro.
| USD | EUR | GBP | CAD | AUD | JPY | NZD | CHF | |
| USD | -0.08% | -0.03% | 0.02% | -0.05% | 0.08% | 0.18% | 0.01% | |
| EUR | 0.08% | 0.05% | 0.08% | 0.02% | 0.16% | 0.26% | 0.09% | |
| GBP | 0.03% | -0.05% | 0.05% | -0.04% | 0.11% | 0.21% | 0.03% | |
| CAD | -0.01% | -0.08% | -0.03% | -0.07% | 0.07% | 0.18% | 0.00% | |
| AUD | 0.06% | 0.01% | 0.07% | 0.07% | 0.14% | 0.24% | 0.07% | |
| JPY | -0.08% | -0.16% | -0.09% | -0.08% | -0.14% | 0.10% | -0.07% | |
| NZD | -0.18% | -0.26% | -0.20% | -0.18% | -0.25% | -0.10% | -0.17% | |
| CHF | -0.01% | -0.06% | -0.03% | 0.00% | -0.08% | 0.10% | 0.17% |
The heat map shows percentage changes of major currencies against each other. The base currency is picked from the left column, while the quote currency is picked from the top row. For example, if you pick the Euro from the left column and move along the horizontal line to the Japanese Yen, the percentage change displayed in the box will represent EUR (base)/JPY (quote).
Indian Rupee FAQs
What are the key factors driving the Indian Rupee?
The Indian Rupee (INR) is one of the most sensitive currencies to external factors. The price of Crude Oil (the country is highly dependent on imported Oil), the value of the US Dollar – most trade is conducted in USD – and the level of foreign investment, are all influential. Direct intervention by the Reserve Bank of India (RBI) in FX markets to keep the exchange rate stable, as well as the level of interest rates set by the RBI, are further major influencing factors on the Rupee.
How do the decisions of the Reserve Bank of India impact the Indian Rupee?
The Reserve Bank of India (RBI) actively intervenes in forex markets to maintain a stable exchange rate, to help facilitate trade. In addition, the RBI tries to maintain the inflation rate at its 4% target by adjusting interest rates. Higher interest rates usually strengthen the Rupee. This is due to the role of the ‘carry trade’ in which investors borrow in countries with lower interest rates so as to place their money in countries’ offering relatively higher interest rates and profit from the difference.
What macroeconomic factors influence the value of the Indian Rupee?
Macroeconomic factors that influence the value of the Rupee include inflation, interest rates, the economic growth rate (GDP), the balance of trade, and inflows from foreign investment. A higher growth rate can lead to more overseas investment, pushing up demand for the Rupee. A less negative balance of trade will eventually lead to a stronger Rupee. Higher interest rates, especially real rates (interest rates less inflation) are also positive for the Rupee. A risk-on environment can lead to greater inflows of Foreign Direct and Indirect Investment (FDI and FII), which also benefit the Rupee.
How does inflation impact the Indian Rupee?
Higher inflation, particularly, if it is comparatively higher than India’s peers, is generally negative for the currency as it reflects devaluation through oversupply. Inflation also increases the cost of exports, leading to more Rupees being sold to purchase foreign imports, which is Rupee-negative. At the same time, higher inflation usually leads to the Reserve Bank of India (RBI) raising interest rates and this can be positive for the Rupee, due to increased demand from international investors. The opposite effect is true of lower inflation.
Japan Finance Minister Shunichi Suzuki is out on the wires, offering some verbal intervention, as the Japanese Yen continues to weaken against the US Dollar.
Key quotes
Watching FX moves 'carefully'.
Forex moves are driven by various factors.
the government is watching FX developments carefully.
its important for FX to move stably, reflecting fundamentals.
Market reaction
The Japanese Yen is recovering some losses on the above comments, dragging USD/JPY lower to 148.25, as of writing. The pair is still up 0.07% on the day.
- USD/CNH extends its losses followed by the support at 23.6% Fibonacci retracement level at 7.1985.
- A break below the 14-day EMA could lead the pair to test the weekly low at 7.1748.
- Technical indicators suggest a bullish momentum to revisit the week’s high at 7.2322.
USD/CNH extends its losses for the second successive session, trading lower near the 7.2100 psychological level during the Asian session on Friday. The People's Bank of China (PBoC) has consistently set the reference rate at levels lower than what modeled estimates suggest. Additionally, strategic moves have been made to bolster the offshore Yuan (CNH) by selling the US Dollar (USD) in the open market.
The 23.6% Fibonacci retracement level at 7.1985 acts as an immediate support followed by the 14-day Exponential Moving Average (EMA) at 7.1899. A firm break below the 14-day EMA could put downward pressure on the USD/CNH pair to navigate the support region around the 38.2% Fibonacci retracement level at 7.1772 aligned with the week’s low at 7.1748.
The technical analysis of the Moving Average Convergence Divergence (MACD) for the USD/CNH pair reveals a bullish outlook. The MACD line is situated above the centerline and displays divergence above the signal line. This configuration suggests a potential uptrend in the market. With this bullish sentiment, there is a possibility that the pair may revisit the week's high at 7.2322.
Furthermore, the 14-day Relative Strength Index (RSI), a lagging indicator, is positioned above the 50 mark. This suggests a confirmation of stronger momentum for the USD/CNH pair. With this increased momentum, there is potential for the bulls to strengthen their position, potentially surpassing the week's high and exploring levels around the psychological mark at 7.2500.
USD/CAD: Daily Chart
- WTI Oil prices struggle to attract follow-through buying and consolidate during the Asian session on Friday.
- Optimistic demand forecasts and concerns over disruptions in Middle East supplies lend support to Oil prices.
- Hopes that the markets will remain well supplied, China's economic woes and a bullish USD seem to cap gains.
West Texas Intermediate (WTI) US Crude Oil prices struggle to build on a two-day-old uptrend and oscillate in a narrow trading band during the Asian session on Friday. The commodity remains below the $74.00/barrel mark, though remains on track to register modest weekly gains in the wake of optimistic demand forecasts.
In fact, both the Organization of the Petroleum Producing Countries (OPEC) and the International Energy Agency (IEA) forecasted an improvement in the global Oil demand over the next two years. Adding to this, an unexpected drop in US crude inventories, led by a 40% drop in North Dakota's Oil output due to extreme cold weather and operational challenges, helps offset fears of slowing economic growth and could act as a tailwind for the black liquid.
Meanwhile, concerns over disruptions in Middle East supplies remained in play as the US-led forces continue to clash with the Iran-backed Houthi group in the Red Sea. Yemen's Houthi rebels launched two anti-ship ballistic missiles at a US-owned, Greek-operated tanker ship on Thursday. In response, the US carried out its fifth strike against Houthi anti-ship missiles, raising the risk of a further escalation of geopolitical tensions and lending support to Oil prices.
That said, dismal economic data from the Eurozone and persistent worries about sustained economic weakness in China – the world’s largest Oil importer – continue to fuel concerns about sluggish demand. Adding to this, expectations that the markets will remain well supplied in the first half of 2024, in the wake of underwhelming production cuts from OPEC and record-high US output, further contribute to keeping a lid on any meaningful upside for Oil prices.
Furthermore, the recent US Dollar (USD) rally to over a one-month top, bolstered by reduced bets for an early interest rate cut by the Federal Reserve (Fed), acts as a headwind for the USD-denominated commodity. This, in turn, warrants some caution for aggressive bullish traders and before positioning for any meaningful appreciating move for Oil prices.
Technical levels to watch
| Raw materials | Closed | Change, % |
|---|---|---|
| Silver | 22.737 | 0.91 |
| Gold | 2022.836 | 0.79 |
| Palladium | 940.8 | 2.95 |
- USD/CAD edges lower to 1.3490 amid improved risk sentiment.
- The US weekly initial jobless claims posted an unexpected drop last week.
- A rebound of oil prices due to Middle East geopolitical tension might boost the commodity-linked Loonie.
- Traders will watch the preliminary US Michigan Consumer Sentiment Index for fresh impetus.
The USD/CAD pair posts a modest loss below the 1.3500 barrier during the early Asian trading hours on Friday. An improved risk sentiment and a slight recovery in oil prices provide some support for the Canadian Dollar (CAD) and weigh on the pair. At press time, USD/CAD is trading at 1.3490, losing 0.03% for the day.
Initial filings for unemployment insurance in the US totaled 187K for the week ended January 13, the lowest level since Sept. 24, 2022. The figure came in better than the market expectation of 207K, according to the Labor Department on Thursday. Meanwhile, the Philadelphia Fed Manufacturing Survey for January arrived at -10.6 versus -12.8 prior. In response to the data, the US Dollar Index edges higher above 103.60 as investors expect the Federal Reserve (Fed) will not rush to lower interest rates.
In contrast to recent robust growth in the United States, the Canadian economy is on the verge of entering a recession. Money markets expect the Fed to lower rates as soon as March, while the Bank of Canada (BoC) to cut the first rates from April. Meanwhile, a rebound in oil prices amid the fear of supply disruptions and geopolitical risk in the Middle East boosts the commodity-linked Loonie.
Market participants will monitor the preliminary US Michigan Consumer Sentiment Index and Existing Home Sales, due on Friday. Additionally, FOMC members M. Daly (San Francisco) and M. Barr (Board of Governors) are set to speak later in the day. Traders will find trading opportunities around the USD/CAD pair.
- The Japanese Yen languishes near its lowest level since November 28 against the USD.
- Japanese consumer inflation eases as expected and reaffirms bets for a BoJ status quo.
- A positive risk tone also undermines the safe-haven JPY and lends support to USD/JPY.
- Reduced bets for a March Fed rate cut and rising US bond yields favour the USD bulls.
The Japanese Yen (JPY) oscillates in a narrow trading band against its American counterpart during the Asian session on Friday and reacts little to domestic consumer inflation figures, which eased as expected in December. Against the backdrop of sluggish wage growth data released last week, the crucial Japan Consumer Price Index (CPI) reaffirmed market expectations that the Bank of Japan (BoJ) will stick to the ultra-dovish stance at its upcoming monetary policy meeting next week. This, along with a stable performance around the equity markets, could undermine the JPY's safe-haven status and allow the USD/JPY pair to prolong its upward trajectory witnessed over the past three weeks or so.
Meanwhile, the US Dollar (USD) stands tall near a more than one-month top and remains on track to post gains for the second week in a row amid reduced bets for an early interest rate cut by the Federal Reserve (Fed). Data released on Thursday showed that the US Initial Jobless Claims dropped to the lowest level in nearly one-and-half years and pointed to the underlying strength in the labor market. This comes on top of stronger US Retail Sales on Wednesday, which suggested that the economy is in good shape and gives the Fed headroom to keep rates higher for longer. This continues to push the US Treasury bond yields higher and acts as a tailwind for the buck, validating the positive outlook for the USD/JPY pair.
Daily Digest Market Movers: Japanese Yen remains depressed amid dovish BoJ expectations
- The Japanese Yen remains within the striking distance of a nearly two-month low against the US Dollar following the release of domestic consumer inflation figures.
- The Statistics Bureau reported that the headline Consumer Price Index (CPI) eased from the 2.8% YoY rate to 2.6% in December – hitting the lowest level since June 2022.
- Japan’s core inflation rate, which strips out prices of volatile fresh food prices, decelerated further from 2.5% in November, to 2.3%, or its lowest level since July 2022,
- This comes on top of the New Year's Day earthquake in Japan and weak wage growth data, ensuring that the Bank of Japan will not pivot away from its ultra-dovish stance.
- Investors further pared bets for an early rate cut by the Federal Reserve after data on Thursday showed that Jobless Claims fell to the lowest level since September 2022.
- The strong labour-market report, along with upbeat US Retail Sales figures on Wednesday, indicated a still-resilient economy and dented expectations for a Fed cut in March.
- According to the CME group's FedWatch Tool, the markets are currently pricing in a 57% chance of an interest rate cut at the March FOMC meeting, down from 75% a week ago.
- In the latest geopolitical developments, Iranian-backed Houthi terrorists in Yemen launched two anti-ship ballistic missiles at a US-owned, Greek-operated tanker ship on Thursday.
- The risk of a further escalation of military action in the Middle East could benefit the JPY's safe-haven status and keep a lid on any meaningful upside for the USD/JPY pair.
- Traders now look to the US macro data – the Preliminary Michigan Consumer Sentiment and Inflation Expectations, along with Existing Home Sales – for a fresh impetus.
- The market attention, meanwhile, will remain glued to the upcoming BoJ monetary policy meeting, which will play a key role in influencing the near-term JPY price dynamics.
Technical Analysis: USD/JPY seems poised to appreciate further, bulls await a move beyond 148.50
From a technical perspective, the range-bound price action witnessed over the past two days might still be categorized as a bullish consolidation phase on the back of over a 750 pips rally from the monthly swing low. Furthermore, the recent breakout through the 147.50 confluence – comprising the 100-day Simple Moving Average (SMA) and the 61.8% Fibonacci retracement level of the November-December downfall – favours bullish traders. This, along with the fact that oscillators on the daily chart are holding comfortably in the positive territory and are still far from being in the overbought zone, suggests that the path of least resistance for the USD/JPY pair is to the upside.
That said, it will still be prudent to wait for some follow-through buying beyond the 148.50-148.55 region, or a multi-week top set on Wednesday, before positioning for any further gains. Spot prices might then accelerate the positive move towards the 149.00 round figure. The upward trajectory could extend further towards the 149.70-149.75 region before the USD/JPY pair eventually aims to conquer the 150.00 psychological mark.
On the flip side, corrective declines towards the 147.50 confluence resistance breakpoint might still be seen as a buying opportunity and remain limited. That said, a convincing break below might prompt some technical selling and drag spot prices further towards the 147.00 round figure. The latter should act as a pivotal point for the USD/JPY pair, which if broken could pave the way for a further decline towards the next relevant support near the 146.60-146.50 region.
Japanese Yen price today
The table below shows the percentage change of Japanese Yen (JPY) against listed major currencies today. Japanese Yen was the strongest against the New Zealand Dollar.
| USD | EUR | GBP | CAD | AUD | JPY | NZD | CHF | |
| USD | -0.07% | 0.02% | 0.01% | 0.00% | 0.12% | 0.10% | -0.02% | |
| EUR | 0.07% | 0.08% | 0.08% | 0.06% | 0.20% | 0.13% | 0.05% | |
| GBP | -0.01% | -0.09% | -0.01% | -0.02% | 0.10% | 0.04% | -0.03% | |
| CAD | -0.01% | -0.08% | 0.01% | -0.03% | 0.11% | 0.06% | -0.03% | |
| AUD | 0.01% | -0.03% | 0.05% | 0.01% | 0.16% | 0.07% | -0.01% | |
| JPY | -0.12% | -0.19% | -0.08% | -0.11% | -0.14% | -0.02% | -0.14% | |
| NZD | -0.09% | -0.17% | -0.05% | -0.10% | -0.14% | 0.01% | -0.12% | |
| CHF | 0.02% | -0.01% | 0.03% | 0.03% | 0.00% | 0.17% | 0.12% |
The heat map shows percentage changes of major currencies against each other. The base currency is picked from the left column, while the quote currency is picked from the top row. For example, if you pick the Euro from the left column and move along the horizontal line to the Japanese Yen, the percentage change displayed in the box will represent EUR (base)/JPY (quote).
Japanese Yen FAQs
What key factors drive the Japanese Yen?
The Japanese Yen (JPY) is one of the world’s most traded currencies. Its value is broadly determined by the performance of the Japanese economy, but more specifically by the Bank of Japan’s policy, the differential between Japanese and US bond yields, or risk sentiment among traders, among other factors.
How do the decisions of the Bank of Japan impact the Japanese Yen?
One of the Bank of Japan’s mandates is currency control, so its moves are key for the Yen. The BoJ has directly intervened in currency markets sometimes, generally to lower the value of the Yen, although it refrains from doing it often due to political concerns of its main trading partners. The current BoJ ultra-loose monetary policy, based on massive stimulus to the economy, has caused the Yen to depreciate against its main currency peers. This process has exacerbated more recently due to an increasing policy divergence between the Bank of Japan and other main central banks, which have opted to increase interest rates sharply to fight decades-high levels of inflation.
How does the differential between Japanese and US bond yields impact the Japanese Yen?
The BoJ’s stance of sticking to ultra-loose monetary policy has led to a widening policy divergence with other central banks, particularly with the US Federal Reserve. This supports a widening of the differential between the 10-year US and Japanese bonds, which favors the US Dollar against the Japanese Yen.
How does broader risk sentiment impact the Japanese Yen?
The Japanese Yen is often seen as a safe-haven investment. This means that in times of market stress, investors are more likely to put their money in the Japanese currency due to its supposed reliability and stability. Turbulent times are likely to strengthen the Yen’s value against other currencies seen as more risky to invest in.
- Australian Dollar gains ground on improved domestic share market following a tech surge on Wall Street.
- Australian subdued employment data reinforced the speculation on early interest rate cuts by the RBA.
- US Dollar gains demand as heightened tensions in the Red Sea bolster the risk aversion sentiment.
- Upbeat US housing and labor data contribute to diminishing the narrative of Fed rate cuts in March.
The Australian Dollar (AUD) moves on an upward trajectory for the second successive day on Friday. The Australian Dollar (AUD gains positive momentum against the US Dollar (USD) due to the strengthened domestic share market, fueled by a technology surge on Wall Street following robust labor data from the United States (US). This surge has heightened market confidence in the economy, and investors are steering clear of uncertainties regarding the interest rate trajectory set by the Federal Reserve (Fed).
Australia’s dollar encounters a hurdle amid speculation surrounding potential early interest rate cuts by the Reserve Bank of Australia (RBA). This belief gained traction following an unexpected decline in Employment Change data released on Thursday for December. Adding to this sentiment, a recent survey of 40 economists conducted by “The Australian Financial Review” indicated that respondents anticipate the RBA initiating interest rate cuts as early as September.
Middle East conflict bolsters the risk aversion sentiment as heightened tensions in the Red Sea are prompting traders to seek safe-haven assets, leading to increased demand for the US Dollar. This, in turn, is exerting downward pressure on the AUD/USD pair. The situation escalated as the US-led military coalition conducted a series of strikes on Houthi targets in Yemen in response to missile attacks by the Iran-backed Houthi group on maritime vessels during the week.
The US Dollar Index (DXY) consolidates with a positive bias to continue its winning streak. Another round of favorable figures in key US indicators has provided further momentum to the upside bias in the US Dollar, reinforcing the prevailing narrative of a more prolonged period of tightened monetary policy by the US Fed. The upward movement in US Treasury yields is also contributing to the positive momentum, providing additional support for the Greenback.
US Housing Starts (MoM) surpassed expectations in December, reaching 1.46 million compared to the anticipated 1.426 million. Building Permits for the month also saw an increase, rising to 1.495 million, surpassing the market consensus of 1.48 million. Meanwhile, Initial Jobless Claims for the week ending on January 12 decreased to 187,000 from the previous reading of 203,000.
However, there was a decline in the Philadelphia Fed Manufacturing Survey for January, registering at -10.6 against the anticipated decline of -7.0. Looking ahead, traders are likely to pay attention to the preliminary Michigan Consumer Sentiment Index for January, with an expected improvement to a reading of 70 from December's figure of 69.7.
Daily Digest Market Movers: Australian Dollar gains ground on improved domestic market
- Australia’s Consumer Inflation Expectations remained steady at 4.5% in January.
- Aussie seasonally adjusted Unemployment Rate held firm at 3.9% in line with expectations for December.
- Australian Employment Change decreased by 65.1K, contrary to the anticipated increase of 17.6K.
- Australia's Consumer Confidence declined by 1.3% in January as compared to the previous increase of 2.7%.
- China’s annual Gross Domestic Product (GDP) grew by 5.2% against the 5.3% expected in the fourth quarter.
- Chinese December’s Industrial Production (YoY) increased by 6.8%. which was expected to remain consistent at 6.6%.
- China’s Retail Sales year-over-year came at 7.4%, falling short of the market consensus of 8.0%.
- Federal Reserve Governor Christopher Waller cautioned that, despite positive developments in the inflation outlook, the central bank is not rushing to outline plans for rate cuts.
- US Retail Sales (MoM) rose by 0.6% in December, exceeding the market consensus of 0.4 and 0.3% prior.
- US Retail Sales Control Group improved to 0.8% from the previous reading of 0.5%.
- US Retail Sales ex Autos (MoM) grew by 0.4% as compared to the market anticipation of remaining consistent at 0.2%.
Technical Analysis: Australian Dollar maintains its position above major level at 0.6550
The Australian Dollar trades near 0.6580 on Friday followed by the psychological resistance level at 0.6600 level. A break above the barrier could push the AUD/USD pair to approach the nine-day Exponential Moving Average (EMA) at 0.6623 followed by the major level at 0.6650. If the pair surpasses the major level, it could attempt to test the psychological level at 0.6700. On the downside, the 50% retracement level at 0.6568 before the major level at 0.6550 could act as an immediate support zone. A break below the zone could influence the AUD/USD pair to navigate the region around the psychological level at 0.6500 aligned with the 61.8% Fibonacci retracement level at 0.6497.
AUD/USD: Daily Chart
-638412254259543472.png)
Australian Dollar price today
The table below shows the percentage change of Australian Dollar (AUD) against listed major currencies today. Australian Dollar was the strongest against the Japanese Yen.
| USD | EUR | GBP | CAD | AUD | JPY | NZD | CHF | |
| USD | -0.07% | 0.02% | 0.01% | 0.00% | 0.12% | 0.10% | -0.02% | |
| EUR | 0.07% | 0.08% | 0.08% | 0.06% | 0.20% | 0.13% | 0.05% | |
| GBP | -0.01% | -0.09% | -0.01% | -0.07% | 0.10% | 0.04% | -0.03% | |
| CAD | -0.01% | -0.08% | 0.01% | -0.03% | 0.11% | 0.06% | -0.03% | |
| AUD | 0.01% | -0.03% | 0.09% | 0.01% | 0.14% | 0.07% | -0.01% | |
| JPY | -0.12% | -0.19% | -0.08% | -0.11% | -0.14% | -0.02% | -0.14% | |
| NZD | -0.09% | -0.17% | -0.08% | -0.10% | -0.14% | 0.04% | -0.12% | |
| CHF | 0.02% | -0.01% | 0.03% | 0.03% | 0.00% | 0.17% | 0.12% |
The heat map shows percentage changes of major currencies against each other. The base currency is picked from the left column, while the quote currency is picked from the top row. For example, if you pick the Euro from the left column and move along the horizontal line to the Japanese Yen, the percentage change displayed in the box will represent EUR (base)/JPY (quote).
Australian Dollar FAQs
What key factors drive the Australian Dollar?
One of the most significant factors for the Australian Dollar (AUD) is the level of interest rates set by the Reserve Bank of Australia (RBA). Because Australia is a resource-rich country another key driver is the price of its biggest export, Iron Ore. The health of the Chinese economy, its largest trading partner, is a factor, as well as inflation in Australia, its growth rate and Trade Balance. Market sentiment – whether investors are taking on more risky assets (risk-on) or seeking safe-havens (risk-off) – is also a factor, with risk-on positive for AUD.
How do the decisions of the Reserve Bank of Australia impact the Australian Dollar?
The Reserve Bank of Australia (RBA) influences the Australian Dollar (AUD) by setting the level of interest rates that Australian banks can lend to each other. This influences the level of interest rates in the economy as a whole. The main goal of the RBA is to maintain a stable inflation rate of 2-3% by adjusting interest rates up or down. Relatively high interest rates compared to other major central banks support the AUD, and the opposite for relatively low. The RBA can also use quantitative easing and tightening to influence credit conditions, with the former AUD-negative and the latter AUD-positive.
How does the health of the Chinese Economy impact the Australian Dollar?
China is Australia’s largest trading partner so the health of the Chinese economy is a major influence on the value of the Australian Dollar (AUD). When the Chinese economy is doing well it purchases more raw materials, goods and services from Australia, lifting demand for the AUD, and pushing up its value. The opposite is the case when the Chinese economy is not growing as fast as expected. Positive or negative surprises in Chinese growth data, therefore, often have a direct impact on the Australian Dollar and its pairs.
How does the price of Iron Ore impact the Australian Dollar?
Iron Ore is Australia’s largest export, accounting for $118 billion a year according to data from 2021, with China as its primary destination. The price of Iron Ore, therefore, can be a driver of the Australian Dollar. Generally, if the price of Iron Ore rises, AUD also goes up, as aggregate demand for the currency increases. The opposite is the case if the price of Iron Ore falls. Higher Iron Ore prices also tend to result in a greater likelihood of a positive Trade Balance for Australia, which is also positive of the AUD.
How does the Trade Balance impact the Australian Dollar?
The Trade Balance, which is the difference between what a country earns from its exports versus what it pays for its imports, is another factor that can influence the value of the Australian Dollar. If Australia produces highly sought after exports, then its currency will gain in value purely from the surplus demand created from foreign buyers seeking to purchase its exports versus what it spends to purchase imports. Therefore, a positive net Trade Balance strengthens the AUD, with the opposite effect if the Trade Balance is negative.
The United States launched new strikes against Houthi anti-ship missiles aimed at the Red Sea on Thursday, according to Reuters.
The US has carried out its fifth strike against Houthi rebel targets in Yemen, while Joe Biden acknowledges that the rebels' continued attacks on Red Sea shipping persist despite the bombings.
Market reaction
At the time of writing, the index is trading near 103.39, unchanged on the day.
Risk sentiment FAQs
What do the terms"risk-on" and "risk-off" mean when referring to sentiment in financial markets?
In the world of financial jargon the two widely used terms “risk-on” and “risk off'' refer to the level of risk that investors are willing to stomach during the period referenced. In a “risk-on” market, investors are optimistic about the future and more willing to buy risky assets. In a “risk-off” market investors start to ‘play it safe’ because they are worried about the future, and therefore buy less risky assets that are more certain of bringing a return, even if it is relatively modest.
What are the key assets to track to understand risk sentiment dynamics?
Typically, during periods of “risk-on”, stock markets will rise, most commodities – except Gold – will also gain in value, since they benefit from a positive growth outlook. The currencies of nations that are heavy commodity exporters strengthen because of increased demand, and Cryptocurrencies rise. In a “risk-off” market, Bonds go up – especially major government Bonds – Gold shines, and safe-haven currencies such as the Japanese Yen, Swiss Franc and US Dollar all benefit.
Which currencies strengthen when sentiment is "risk-on"?
The Australian Dollar (AUD), the Canadian Dollar (CAD), the New Zealand Dollar (NZD) and minor FX like the Ruble (RUB) and the South African Rand (ZAR), all tend to rise in markets that are “risk-on”. This is because the economies of these currencies are heavily reliant on commodity exports for growth, and commodities tend to rise in price during risk-on periods. This is because investors foresee greater demand for raw materials in the future due to heightened economic activity.
Which currencies strengthen when sentiment is "risk-off"?
The major currencies that tend to rise during periods of “risk-off” are the US Dollar (USD), the Japanese Yen (JPY) and the Swiss Franc (CHF). The US Dollar, because it is the world’s reserve currency, and because in times of crisis investors buy US government debt, which is seen as safe because the largest economy in the world is unlikely to default. The Yen, from increased demand for Japanese government bonds, because a high proportion are held by domestic investors who are unlikely to dump them – even in a crisis. The Swiss Franc, because strict Swiss banking laws offer investors enhanced capital protection.
The People’s Bank of China (PBoC) set the USD/CNY central rate for the trading session ahead on Friday at 7.1167 as compared to the previous day's fix of 7.1174 and 7.1972 Reuters estimates.
- GBP/USD gains traction around 1.2708 amid the weaker USD, risk-on sentiment.
- UK CPI inflation rose for the first time in 10 months, rising to 4.0% YoY vs. 3.9% prior.
- Fed’s Bostic expects that policymakers will begin cutting interest rates in the third quarter of this year.
- Traders await the December UK Retail Sales and the preliminary US Michigan Consumer Sentiment Index, due on Friday.
The GBP/USD pair trades firm for the third consecutive day during the early Asian session on Friday. The uptick in the major pair is bolstered by the upbeat UK inflation data and the risk-on mood. Investors await the UK Retail Sales report on Friday for fresh impetus, which is estimated to show a decline of 0.5% MoM in December from a 1.3% rise in November. GBP/USD currently trades near 1.2708, up 0.08% on the day.
The annual rate of the UK Consumer Price Index (CPI) rose to 4.0% YoY from 3.9% in November, undermining market expectations of an early rate cut by the Bank of England (BoE). This figure marked the first acceleration in ten months. The former BoE policymaker, Michael Saunders, said that he did not think the latest data contradicted the broader underlying decline in inflation.
Nonetheless, traders slashed their bets on BoE rate cuts. The markets have priced in a 50% odds of a quarter-point cut to borrowing costs by the BoE in May, down from an 80% chance on Tuesday. This, in turn, lends some support to the British Pound (GBP) and acts as a tailwind for the GBP/USD pair.
Late Thursday, Atlanta Federal Reserve (Fed) President Raphael Bostic anticipates that policymakers will begin cutting interest rates in the third quarter of this year as inflation is approaching the central bank’s target. The fed funds futures market is pricing in the first rate cuts as early as March, according to the CME FedWatch tool. However, the implied probability of a quarter percentage point rate cut has declined in recent days to 57% on Thursday morning.
Moving on, investors will keep an eye on the UK Retail Sales for December and the preliminary US Michigan Consumer Sentiment Index on Friday. Market participants will take cues from the data and find trading opportunities around the GBP/USD pair.
| Index | Change, points | Closed | Change, % |
|---|---|---|---|
| NIKKEI 225 | -11.58 | 35466.17 | -0.03 |
| Hang Seng | 114.89 | 15391.79 | 0.75 |
| KOSPI | 4.14 | 2440.04 | 0.17 |
| ASX 200 | -46.6 | 7346.5 | -0.63 |
| DAX | 135.66 | 16567.35 | 0.83 |
| CAC 40 | 82.66 | 7401.35 | 1.13 |
| Dow Jones | 201.94 | 37468.61 | 0.54 |
| S&P 500 | 41.73 | 4780.94 | 0.88 |
| NASDAQ Composite | 200.03 | 15055.65 | 1.35 |
| Pare | Closed | Change, % |
|---|---|---|
| AUDUSD | 0.65737 | 0.34 |
| EURJPY | 161.079 | -0.04 |
| EURUSD | 1.08754 | -0.05 |
| GBPJPY | 188.208 | 0.3 |
| GBPUSD | 1.27066 | 0.24 |
| NZDUSD | 0.61159 | 0.03 |
| USDCAD | 1.34859 | -0.14 |
| USDCHF | 0.86805 | 0.45 |
| USDJPY | 148.12 | 0.03 |
- NZD/USD gains ground near 0.6120, adding 0.13% for the day.
- US Initial Jobless Claims reached their lowest level since September 2022.
- New Zealand’s Business NZ PMI eased to 43.1 in December from November's 46.7.
The NZD/USD pair trades on a positive note during the early Asian session on Friday. The pair finds support near the 100-day Exponential Moving Average (EMA) at 0.6115 and currently trades around 0.6120. The New Zealand Consumer Price Index (CPI) next week will be a closely watched event and could offer hints about further monetary policy updates from the Reserve Bank of New Zealand (RBNZ).
The Labor Department revealed on Thursday that US Initial Jobless Claims reached their lowest level since September 2022. The Initial claims for state unemployment benefits dropped to 187,000 for the week ended January 13 from 203,000 in the previous reading. The total for continuing claims hit 1.806 million, better than the 1.845 million estimated.
The upbeat data could make it difficult for the Federal Reserve (Fed) to begin cutting interest rates in March. Investors have lowered their bets for a rate cut at the March meeting to below 60%, according to CME Group's FedWatch Tool.
On the Kiwi front, the markets expect the RBNZ to begin its easing cycle in August 2024, taking the OCR to 3.5% over 12 months. Traders will take more cues from the New Zealand inflation data next week. The Q4 headline CPI is expected to decelerate sharply from 5.6% to 4.7% YoY (0.6% QoQ).
The latest data from Business NZ showed that New Zealand’s Performance of Manufacturing Index (PMI) eased to 43.1 in December from November's 46.7. The figure registered the ninth consecutive month of contraction in manufacturing activity in New Zealand.
Looking ahead, market players will monitor the preliminary US Michigan Consumer Sentiment Index for January and Existing Home Sales. Later in the day, FOMC members M. Daly (San Francisco) and M. Barr (Board of Governors) are scheduled to deliver speeches. These data could give a clear direction to the NZD/USD pair.


© 2000-2026. Уcі права захищені.
Cайт знаходитьcя під керуванням TeleTrade DJ. LLC 2351 LLC 2022 (Euro House, Richmond Hill Road, Kingstown, VC0100, St. Vincent and the Grenadines).
Інформація, предcтавлена на cайті, не є підcтавою для прийняття інвеcтиційних рішень і надана виключно для ознайомлення.
Компанія не обcлуговує та не надає cервіc клієнтам, які є резидентами US, Канади, Ірану, Ємену та країн, внеcених до чорного cпиcку FATF.
Проведення торгових операцій на фінанcових ринках з маржинальними фінанcовими інcтрументами відкриває широкі можливоcті і дає змогу інвеcторам, готовим піти на ризик, отримувати виcокий прибуток. Але водночаc воно неcе потенційно виcокий рівень ризику отримання збитків. Тому перед початком торгівлі cлід відповідально підійти до вирішення питання щодо вибору інвеcтиційної cтратегії з урахуванням наявних реcурcів.
Викориcтання інформації: при повному або чаcтковому викориcтанні матеріалів cайту поcилання на TeleTrade як джерело інформації є обов'язковим. Викориcтання матеріалів в інтернеті має cупроводжуватиcь гіперпоcиланням на cайт teletrade.org. Автоматичний імпорт матеріалів та інформації із cайту заборонено.
З уcіх питань звертайтеcь за адреcою pr@teletrade.global.
переклади