- Analytics
- News and Tools
- Market News
- Gold Price Forecast: XAU/USD idles critical support, $1,720/1,800 eyed
Gold Price Forecast: XAU/USD idles critical support, $1,720/1,800 eyed
- Gold is in the balance of the market's forecasts for stagflation.
- Gold is at the mercy of the Fed, inflation risks and US jobs and other critical data this week.
The price of gold is higher by some 0.38% around the close of Wall Street as US equities plummet. The Dow fell more than 100 points as stocks end lower ahead of bank earnings, inflation data. The S&P 500 was 0.25% lower and the Nasdaq ended down 0.14%.
Meanwhile, the carry trade and commodity currencies are taking up the top leader boards, where rate hikes are now being priced in. The US dollar DXY, an index that measures the US dollar vs a basket of major rivals, is trading through 93.50 and is at the highest level since Sep 2020 as the market prices in the Federal reserve's tapering and rate hike expectations in 2021 and 2022 respectively.
Inflation and stagflation risks weighed
Risk markets have stabilised as inflation uncertainty continued to creep higher despite a dismal Nonfarm payrolls headline last week. However, investors will now look to the next key US data releases in September Consumer Price Index and Retail Sales which will be important in the current stagflation debate for which gold is akin.
''Looking beyond Fed pricing, higher wages and no rise in the participation rate, along with the ongoing energy crisis, will keep the stagflation theme alive,'' analysts at TD Securities explained. ''As such, gold could be an ideal hedge against these rising stagflationary winds, while a positioning slate that is skewed short also suggests that a further rout on the yellow metal is unlikely.''
Indeed, recent Fedspeak and inflation expectations data have indicated that confidence in the transitory inflation story is continuing to fade. This makes for September's CPI data that are due Wednesday important. The market is expecting 5.3% YoY and 4.0% YoY respectively on headline and core.
Meanwhile, as the global energy crisis intensifies, impacting the production of goods across the world and supply chains across Europe and Asia, reasons to own the yellow metal are growing more compelling, analysts at TD Securities argued.
''Indeed, as these issues fuel concerns of slowing demand and rising inflation, price action across rates in recent trading sessions suggest that global macro is just starting to price in implications of the energy crisis,'' the analysts pointed pout. ''After all,'' they say, ''the Post-Fed move higher in rates was led by real rates, whereas it is now being led by breakevens, suggesting the market is pricing in higher inflation due to the spike in energy, but acknowledging that this is a supply-shock which impacts growth negatively.''
''In turn, with positioning in the yellow metal increasingly short, including CTAs, potential strength in gold due to this growing stagflationary narrative could spark aggressive short covering on the horizon.''
Gold positioning
From a positioning standpoint, speculators have opted to add back some along following the breakout in Treasury yields that have been weighing on momentum, eventually sending the yellow metal to the lows. Still, short covering did not last long as investors look to the Fed for the November taper. Looking forward, however, there is plenty of dry powder on the sidelines which could help drive gold higher as investors look for traditional hedges vs stagflationary themes.
Gold technical analysis
In the Chart of the Week: XAU/USD bulls step in, the 4-hour support was noted as follows:
Gold 4-hour chart, prior analysis
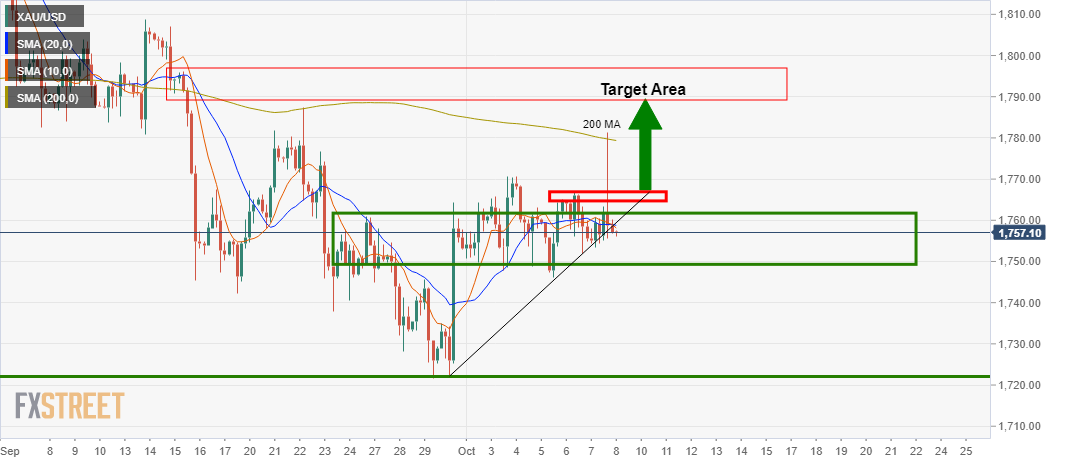
It was stated at the start of the week's analysis that, ''from a 4-hour perspective, gold bulls would be prudent to see the price make a move in the direction of the target to break the near term resistance around $1,770. In engaging above this area, there is a higher probability of a bullish continuation for gold this week.'
However, the bears have been testing the grit of the bulls and the price has moved sideways along horizontal support and pushing dynamic support further out along the trend as follows:
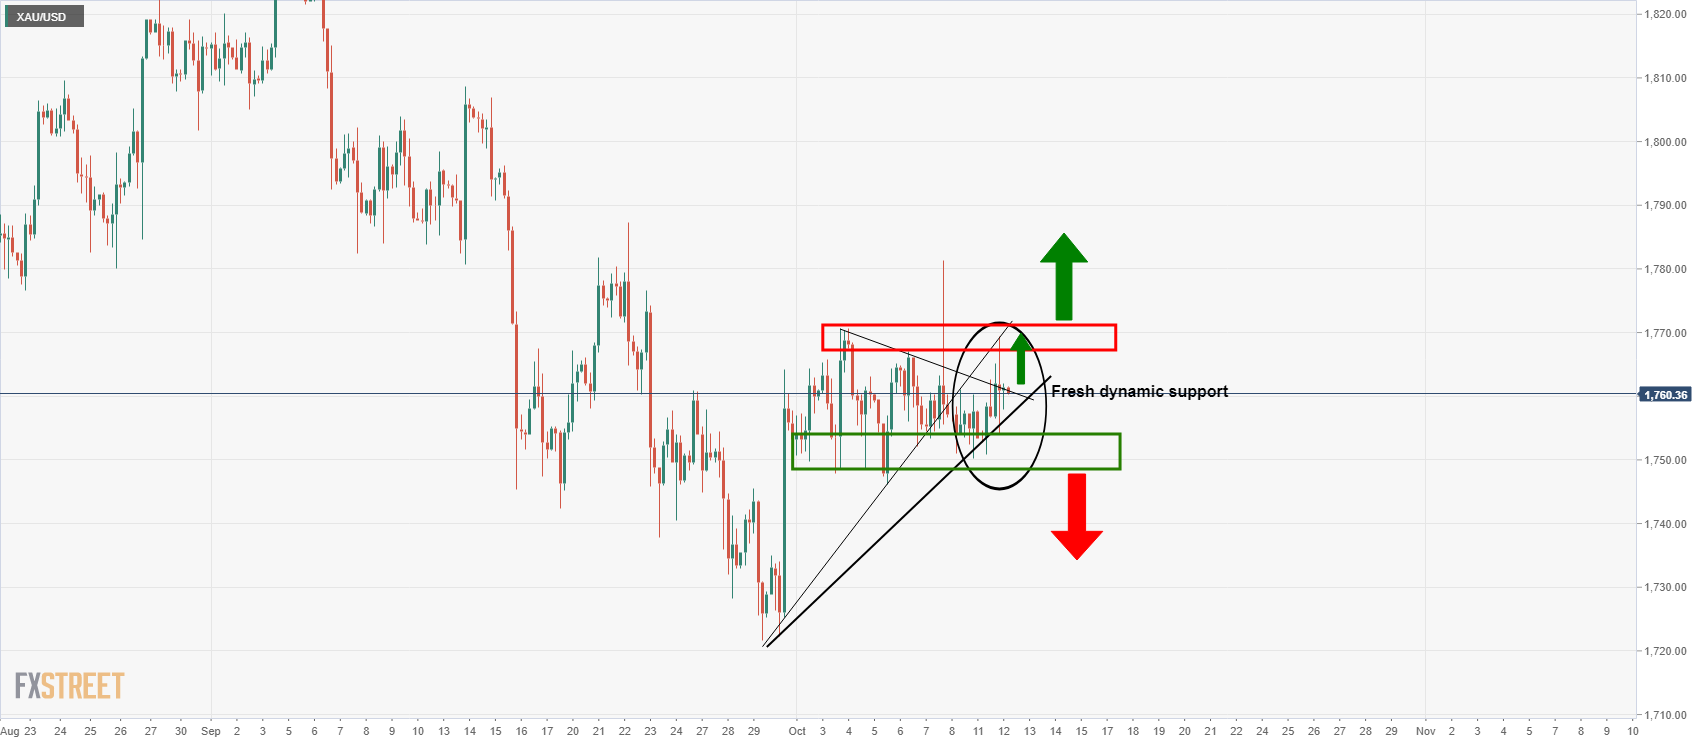
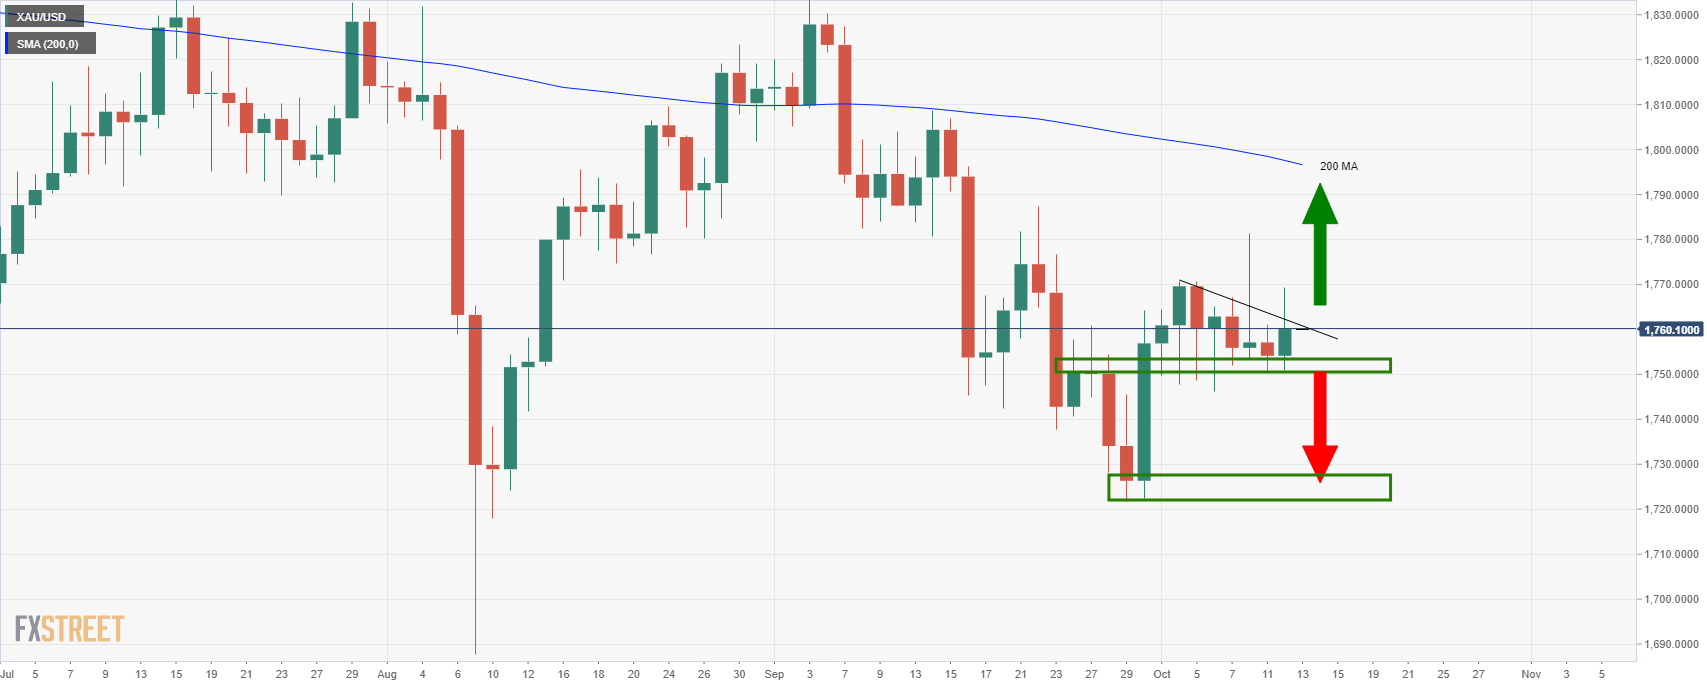
Should the price break the dynamic resistance that has formed and test into the 1,770 resistance area, then there are prospects of the bullish breakout. On the other hand, a break below the 1,750 would likely lead to a downside continuation from a daily perspective towards 1,720 and void the daily upside target towards the 200 MA near 1,800:


© 2000-2026. All rights reserved.
This site is managed by Teletrade D.J. LLC 2351 LLC 2022 (Euro House, Richmond Hill Road, Kingstown, VC0100, St. Vincent and the Grenadines).
The information on this website is for informational purposes only and does not constitute any investment advice.
The company does not serve or provide services to customers who are residents of the US, Canada, Iran, The Democratic People's Republic of Korea, Yemen and FATF blacklisted countries.
Making transactions on financial markets with marginal financial instruments opens up wide possibilities and allows investors who are willing to take risks to earn high profits, carrying a potentially high risk of losses at the same time. Therefore you should responsibly approach the issue of choosing the appropriate investment strategy, taking the available resources into account, before starting trading.
Use of the information: full or partial use of materials from this website must always be referenced to TeleTrade as the source of information. Use of the materials on the Internet must be accompanied by a hyperlink to teletrade.org. Automatic import of materials and information from this website is prohibited.
Please contact our PR department if you have any questions or need assistance at pr@teletrade.global.
transfers