- Analytics
- News and Tools
- Market News
- EUR/USD Price Analysis: Bravest bears seeking lower lows still
EUR/USD Price Analysis: Bravest bears seeking lower lows still
- EUR/USD bears are looking for a downside continuation to test weekly targets.
- At resistance, the hourly chart is riping for a downside continuation following a significant correction.
EUR/USD has seen a tremendous sell-off throughout Sep to date. The price has fallen from a fractal weekly high of 1.1909 to fresh lows at 1.1524 and into territory not traded in since July 2020. At this juncture, the price is not far off from the weekly 9 March candle's high of 1.1496 and then 1.1425 as being the 8 June weekly candle high. These are target levels for the bravest of bears who are still in anticipation of immediate lower levels.
The path of least resistance could well be to the upside at this juncture, given the weekly drop is expected to correct. However, according to the daily chart and momentum indicators, as well as the aforementioned weekly targets, there could still be some juice left to be squeezed out of this weekly move for day traders.
The following illustrates both the bullish and bearish bias in a top-down analysis, usually starting first with the monthly chart, then moving all the way into the 15-min chart. However, for the sake of the order of priority, we will look at the hourly and 15-min conditions that could offer a potential trade opportunity for day trades over the coming sessions.
EUR/USD 1-hour chart
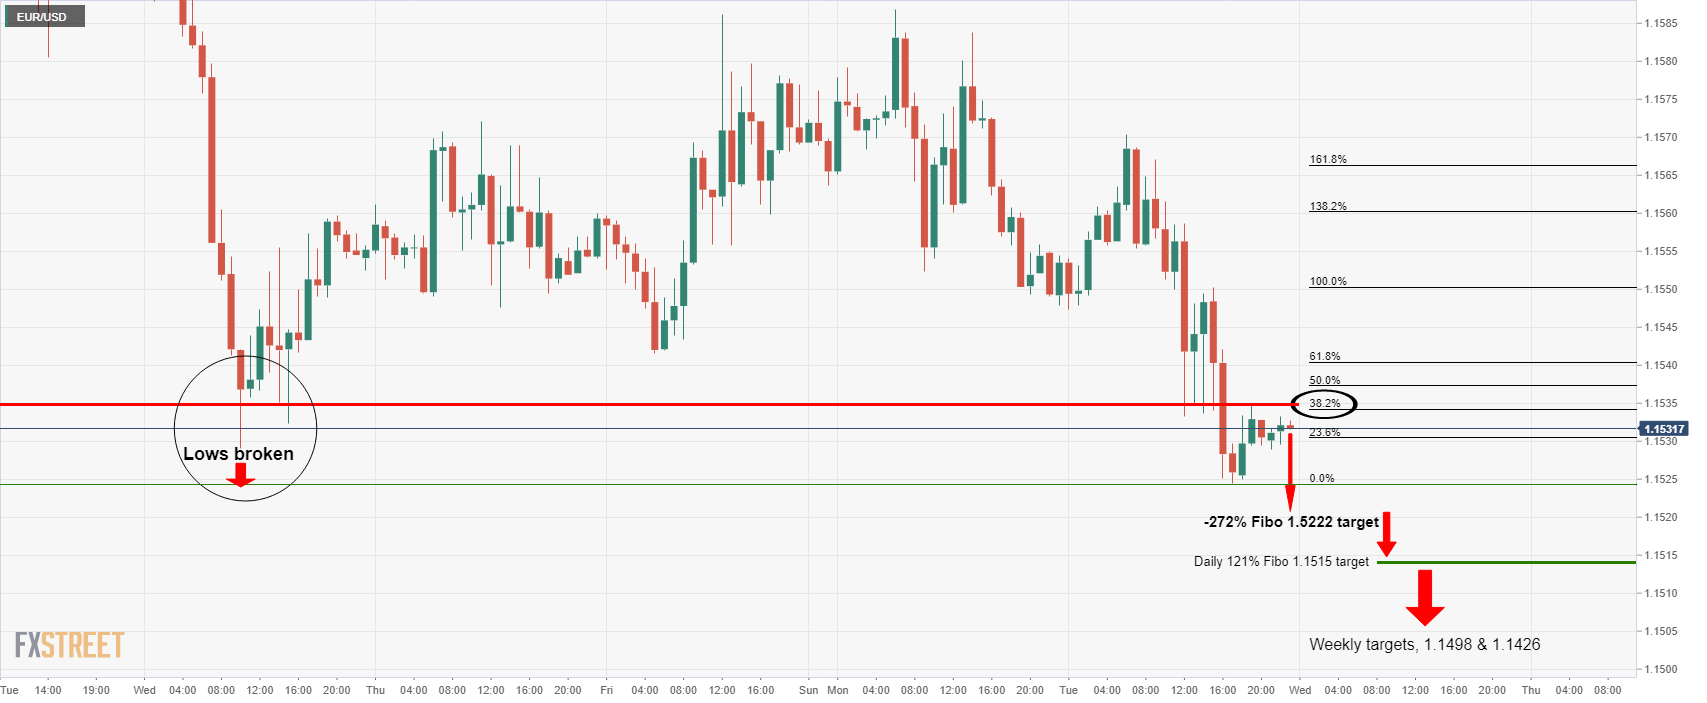
The hourly chart has seen the price fall in a bearish impulse and a correction to a significant level on the Fibonacci scale. The correction is stalling and the deceleration would be expected to lead to a downside continuation towards hourly, daily Fibo, or even, weekly structure targets as illustrated above.
EUR/USD, 15-min chart
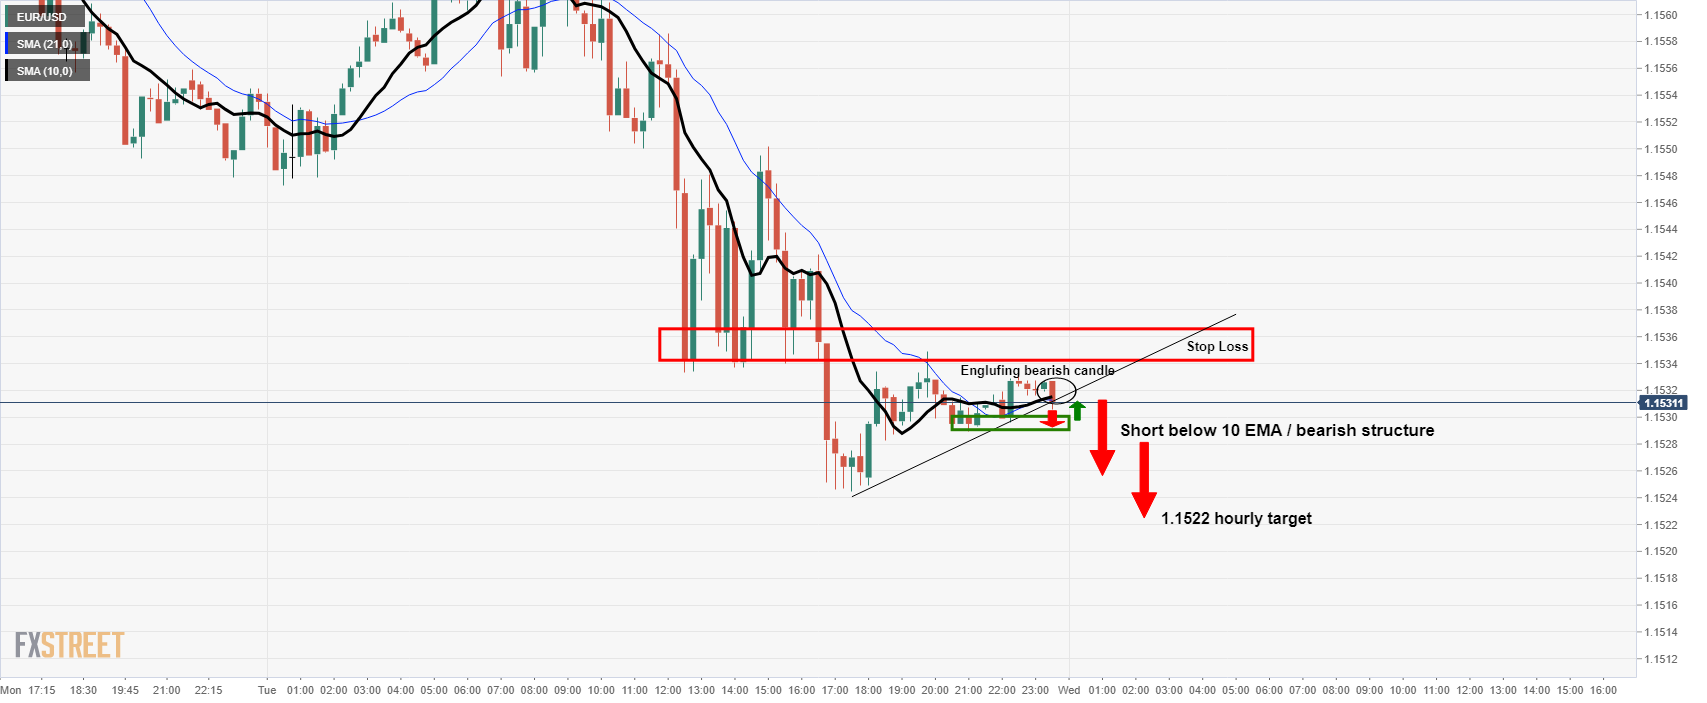
The 15 min time frame from where to execute the break of a support structure is showing an engulfing bearish test of the trendline support. A break there will likely engage the bears and potentially trigger a break of horizontal support near 1.1530 as being the prior day's closing price.
The market is bearish below there and traders can engage for a run to the hourly -272% Fibonacci retracement of the correction's range at 1.1522. However, given the quiet Asian session, the process could be slow but the Tokyo open and subsequent trade could add some life to an otherwise sleepy market.
More to come on the longer-term analysis...


© 2000-2026. All rights reserved.
This site is managed by Teletrade D.J. LLC 2351 LLC 2022 (Euro House, Richmond Hill Road, Kingstown, VC0100, St. Vincent and the Grenadines).
The information on this website is for informational purposes only and does not constitute any investment advice.
The company does not serve or provide services to customers who are residents of the US, Canada, Iran, The Democratic People's Republic of Korea, Yemen and FATF blacklisted countries.
Making transactions on financial markets with marginal financial instruments opens up wide possibilities and allows investors who are willing to take risks to earn high profits, carrying a potentially high risk of losses at the same time. Therefore you should responsibly approach the issue of choosing the appropriate investment strategy, taking the available resources into account, before starting trading.
Use of the information: full or partial use of materials from this website must always be referenced to TeleTrade as the source of information. Use of the materials on the Internet must be accompanied by a hyperlink to teletrade.org. Automatic import of materials and information from this website is prohibited.
Please contact our PR department if you have any questions or need assistance at pr@teletrade.global.
transfers