- Analytics
- News and Tools
- Market News
- AUD/NZD Price Analysis: Accumulation is occurring, bulls taking over
AUD/NZD Price Analysis: Accumulation is occurring, bulls taking over
- AUD/NZD M-formation on the daily chart is compelling.
- Wycoff Methodology is playing out on the 1-hour chart.
As per the prior analysis, ''AUD/NZD Price Analysis: Bulls waiting to pounce'', the price is representing much of the Wycoff accumulation theory in the recent consolidation of the bear trend on the daily chart.
The daily chart is compelling given the harmonic M-formation. This is a reversion pattern as follows:
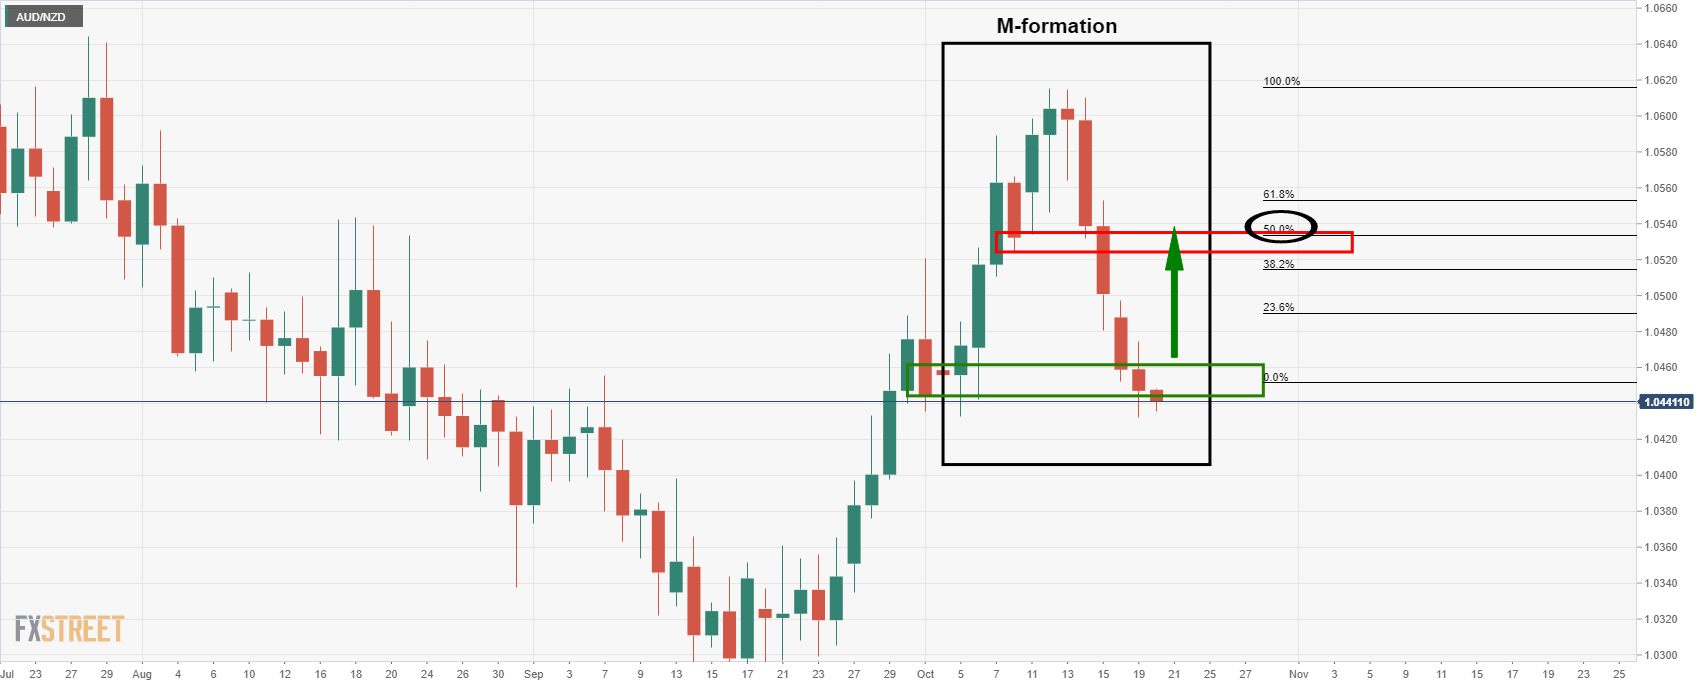
This chart was from the prior day's analysis where it was explained that ''the pattern that would be expected to draw in the price for a test of the formation's neckline. In this case, that level is the 8 Oct low at 1.0524.''
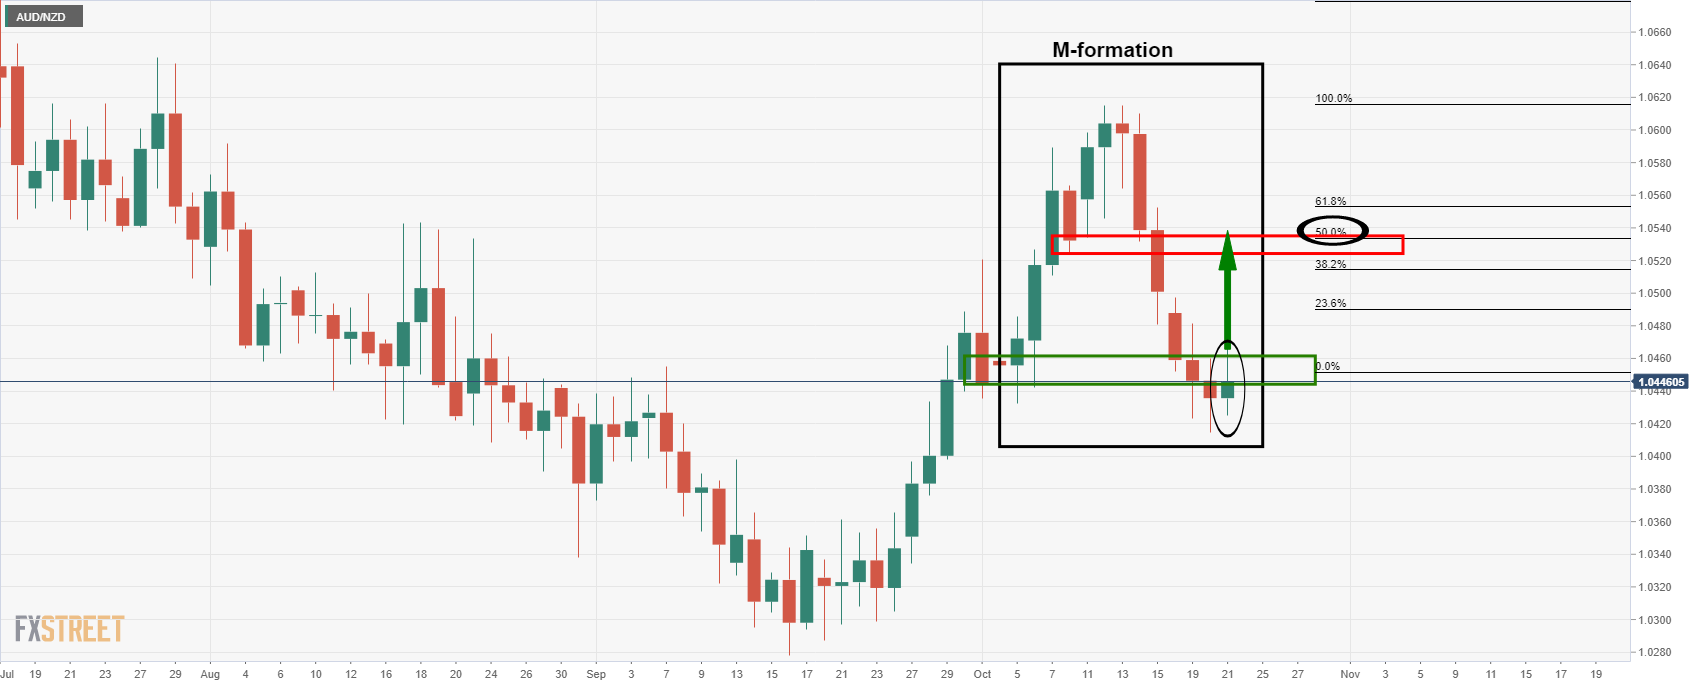
Since that analysis, we have seen the price start to correct, as expected:
Meanwhile, traders can approach the reversion from an hourly perspective and taking into consideration the Wycoff method can help traders keep out of bull and bear traps throughout the prolonged accumulation phase. This phase of accumulation is renowned for its whipsaw price action as demand outstrips supply in a battle between the bears and bulls, aka, the barroom brawl. In applying the thesis, it can assist traders to be patient and wait for signals that supply is exhausted before committing to the market long.
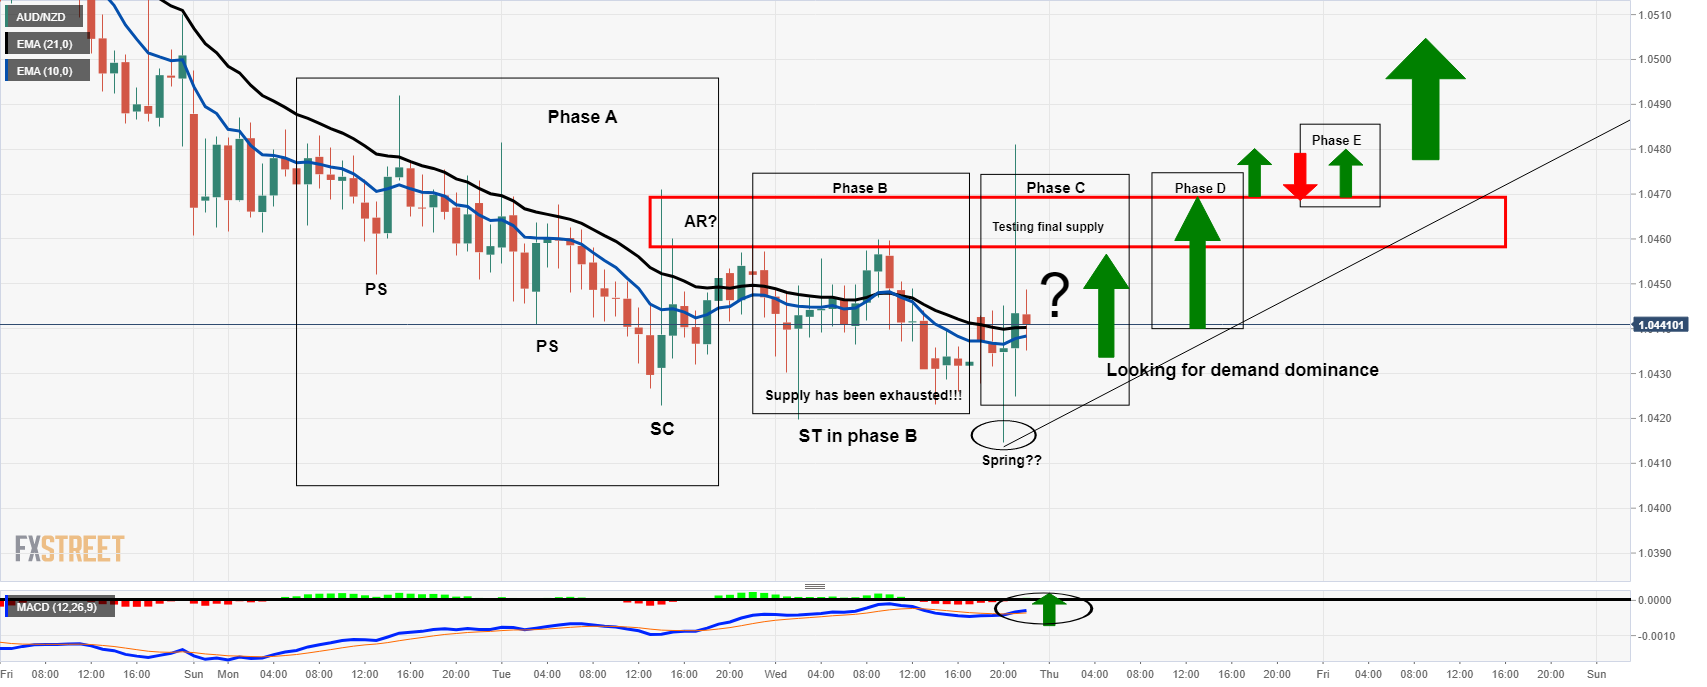
Wycoff 1HR chart
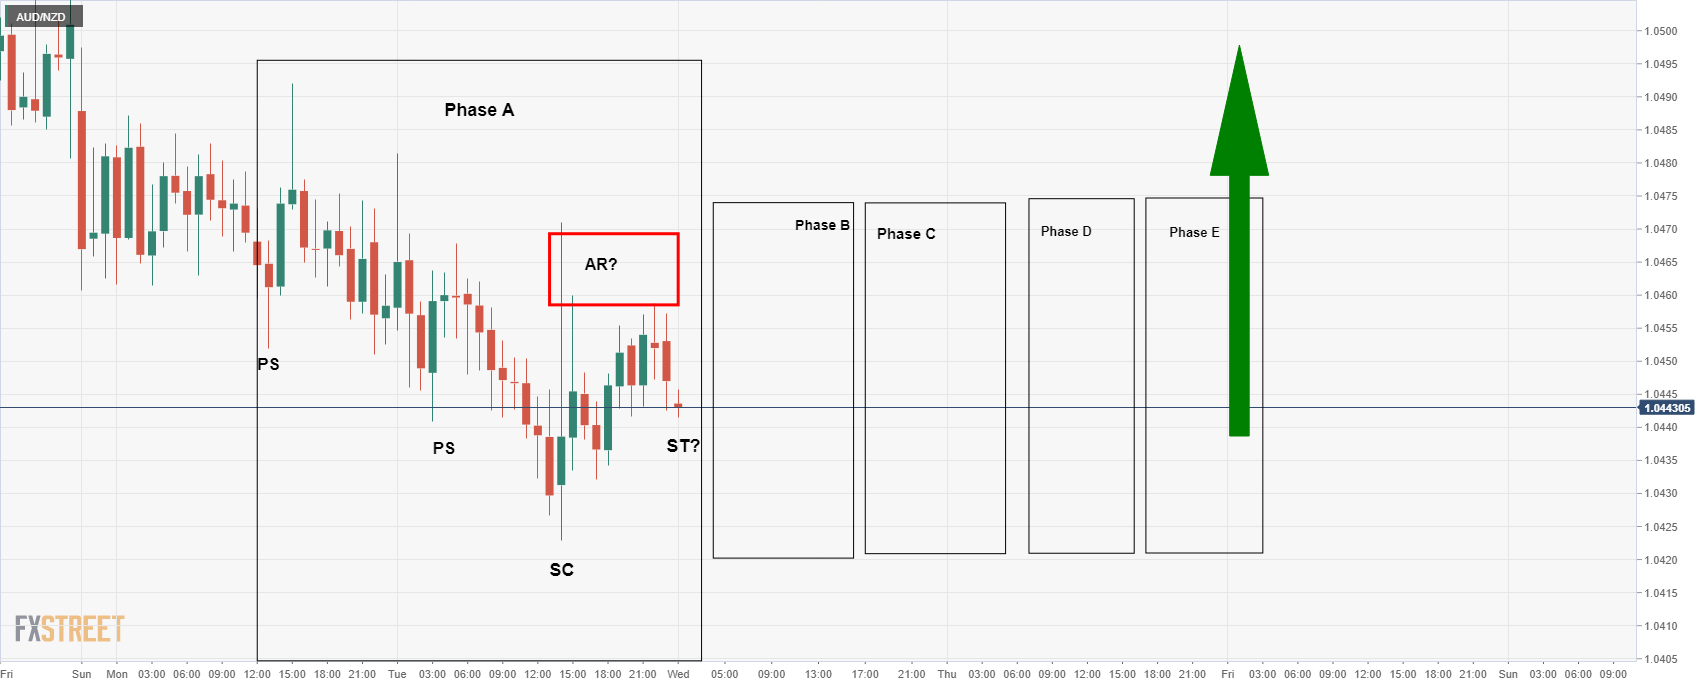
In the above analysis from yesterday, it was illustrated that Phase A was playing out. This was intended to help traders to stay patient and wait for the accumulation to play out through stages as follows:
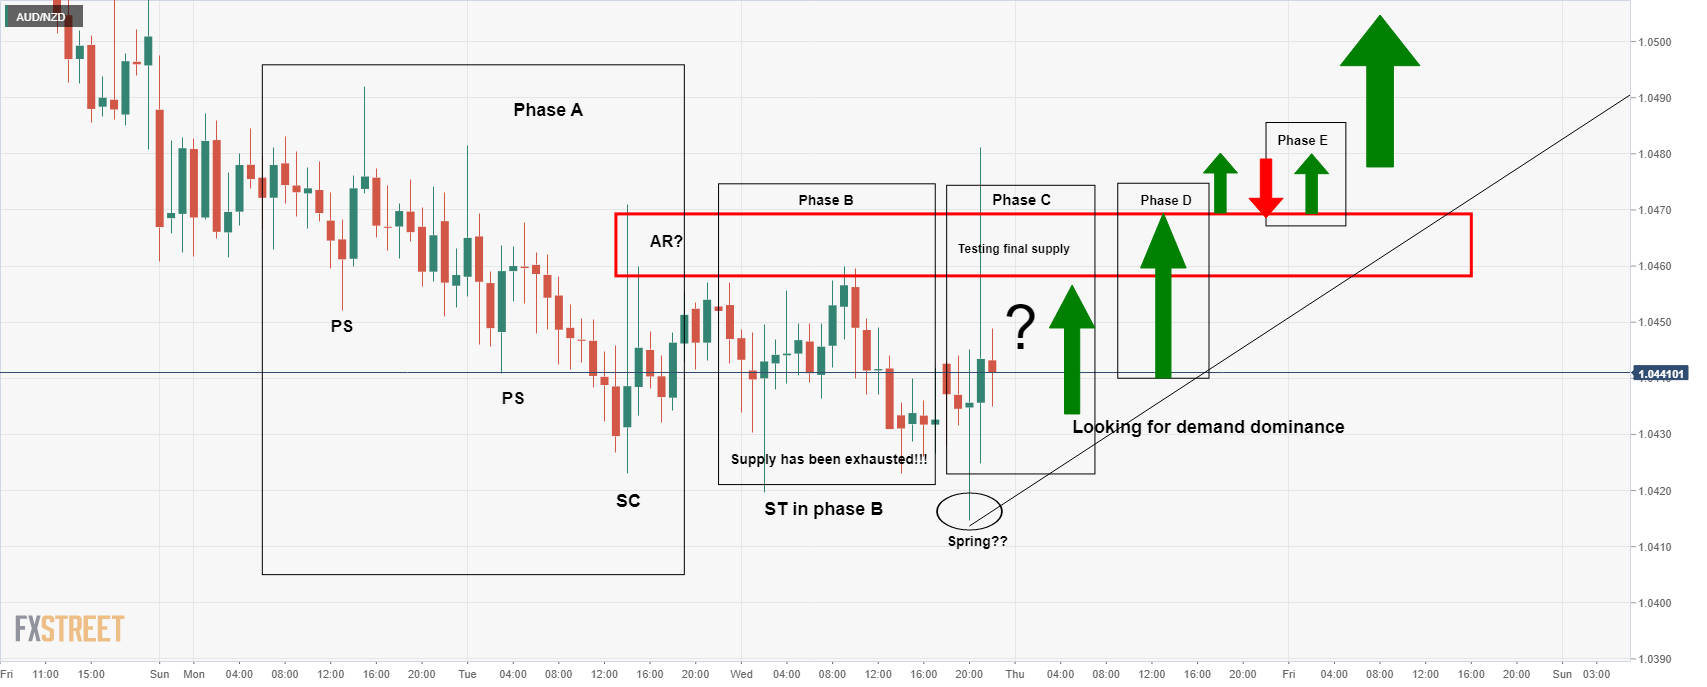
In this updated version in today's live market analysis, we can see how well this theory is playing out. At this juncture, traders can expect demand to dominate while investors buy up the cross one chunk at a time as sellers move to the sidelines and exit their long positions, propelling the price even higher towards the resistance.
How to know when accumulation is going to lead to a breakout?
Traders can read both the price action, looking for higher lows and higher highs, as well as useful indicators. One way to identify bullish territory is to apply MACD and a moving average crossover as follows:
When MACD, blue line, crosses above the zero line, black horizontal, then this is regarded as indicating that buyers indeed have control and that the environment is turning bullish. When applying a moving average crossover, such as the 10 moving up through the 21 EMA, this is a powerful combination to help identify buying conditions. At such a point that this occurs, bulls can look to engage, depending on price action and market structure, and target towards the daily M-formation's neckline.
Traders will look to price action for engulfing candles and/or momentum candles that are breaking short-term resistances. Once the resistance is broken, a classic way to engage is to wait for a pullback to restest the old resistance that would be expected to act as support and lead to a bull rally.


© 2000-2026. All rights reserved.
This site is managed by Teletrade D.J. LLC 2351 LLC 2022 (Euro House, Richmond Hill Road, Kingstown, VC0100, St. Vincent and the Grenadines).
The information on this website is for informational purposes only and does not constitute any investment advice.
The company does not serve or provide services to customers who are residents of the US, Canada, Iran, The Democratic People's Republic of Korea, Yemen and FATF blacklisted countries.
Making transactions on financial markets with marginal financial instruments opens up wide possibilities and allows investors who are willing to take risks to earn high profits, carrying a potentially high risk of losses at the same time. Therefore you should responsibly approach the issue of choosing the appropriate investment strategy, taking the available resources into account, before starting trading.
Use of the information: full or partial use of materials from this website must always be referenced to TeleTrade as the source of information. Use of the materials on the Internet must be accompanied by a hyperlink to teletrade.org. Automatic import of materials and information from this website is prohibited.
Please contact our PR department if you have any questions or need assistance at pr@teletrade.global.
transfers