- Analytics
- News and Tools
- Market News
- US Stocks Forecast: S&P 500 moves in on all time highs despite rising yields
US Stocks Forecast: S&P 500 moves in on all time highs despite rising yields
- The Dow Jones Industrial Average is down 0.17% to 35,442.5.
- The S&P 500 is just shy of a record close Wednesday. The Nasdaq rose 0.5%.
- US yields are making fresh cycle highs with more to come.
US stocks are on Thursday while government bond yields have touched a fresh five-month high after initial jobless claims fell to their latest low since the start of the pandemic.
The Dow Jones Industrial Average is down 0.17% to 35,442.53 the low on the day after setting an intraday high, while the S&P 500 added 0.18% after six straight gains that left it just shy of a record close Wednesday. The Nasdaq rose 0.5%. The S&P 500 posted 51 new 52-week highs and no new lows; the Nasdaq Composite recorded 93 new highs and 33 new lows. Consumer discretionary shares have fared best so far, while materials and energy lagged.
Seven of the 11 major S&P 500 sectors were trading lower, with energy stocks declining the most. Consumer discretionary was the biggest percentage gainer among the S&P sectors so far, with help from Amazon.com Inc. Meanwhile, analysts are expecting S&P 500 third-quarter earnings to rise 33.7% year-on-year, according to Refinitiv.
In the economic calendar, Initial jobless claims fell to 290,000 in the US during the week ended Oct. 16 from an upwardly revised 296,000 in the previous week. The four-week moving average fell by 15,250 to 319,750, a new low since the start of the COVID-19 pandemic. In other data, the US existing home sales climbed 7% in September to a seasonally adjusted annual rate of 6.29 million from 5.88 million in August, exceeding expectations for a rise to 6.1 million.
Meanwhile, market-implied expectations for US inflation for the next five years have surged to the highest in 15 years as measured by breakevens, Bloomberg reported.
US yields on Thursday have indeed moved higher on Thursday with the 10-year printing a fresh 1.682% high on the approach to the March highs of 1.774% from a technical perspective:
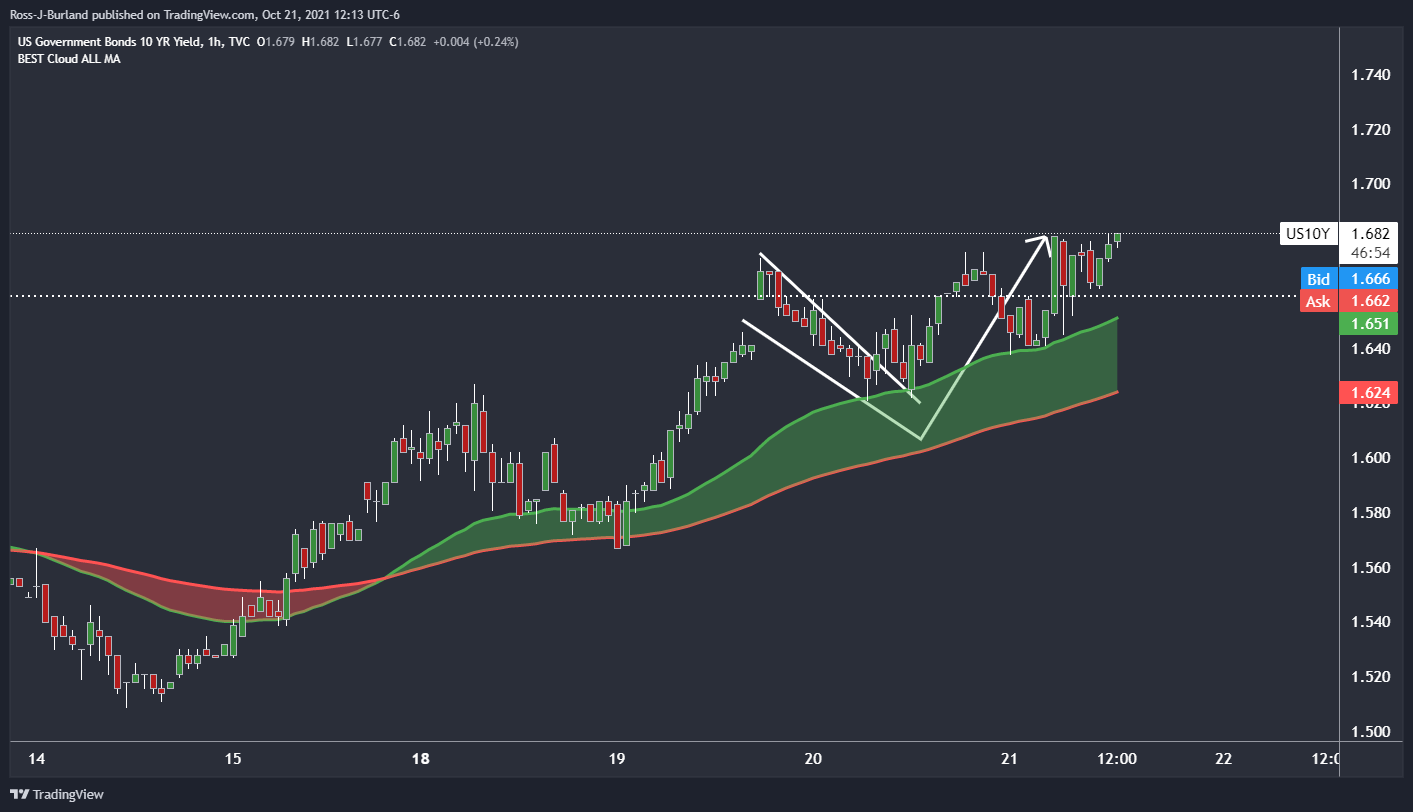
From a daily perspective, there are prospects of a move beyond the daily highs towards a -272% Fibonacci retracement of the current daily flag's range:

S&P 500 technical analysis
-637704399854184329.png)
The S&P 500 is a compelling technical picture given the counter-trendline and combination of the W-formation. Both are bearish as the counter-trendline would be expected to act as resistance on a restest and the W-formaiton is a reversion pattern. The price would be expected to test the neckline of the W-formation at 4,483 following a restest of the counter trendline.


© 2000-2026. All rights reserved.
This site is managed by Teletrade D.J. LLC 2351 LLC 2022 (Euro House, Richmond Hill Road, Kingstown, VC0100, St. Vincent and the Grenadines).
The information on this website is for informational purposes only and does not constitute any investment advice.
The company does not serve or provide services to customers who are residents of the US, Canada, Iran, The Democratic People's Republic of Korea, Yemen and FATF blacklisted countries.
Making transactions on financial markets with marginal financial instruments opens up wide possibilities and allows investors who are willing to take risks to earn high profits, carrying a potentially high risk of losses at the same time. Therefore you should responsibly approach the issue of choosing the appropriate investment strategy, taking the available resources into account, before starting trading.
Use of the information: full or partial use of materials from this website must always be referenced to TeleTrade as the source of information. Use of the materials on the Internet must be accompanied by a hyperlink to teletrade.org. Automatic import of materials and information from this website is prohibited.
Please contact our PR department if you have any questions or need assistance at pr@teletrade.global.
transfers