- Analytics
- News and Tools
- Market News
- Gold Price Forecast: XAU/USD volatile within $1800-$1770 range ahead of Fed – Confluence Detector
Gold Price Forecast: XAU/USD volatile within $1800-$1770 range ahead of Fed – Confluence Detector
- Gold price falls further amid pre-Fed anxiety, DXY, yields hold firmer.
- The Fed is likely to announce tapering by $15 billion per month.
- Fed November Preview: Gold needs a dovish surprise to overcome key hurdle.
It’s the all-important Fed Day this Wednesday, with the US dollar and Treasury yields firming up, as a rollback of asset purchases by $15 billion per month is already discounted by the market. Gold traders will look for hints on the Fed’s timing of the interest rates hike and the inflation outlook to steer the fresh direction in the bright metal. Ahead of the Fed event, the US ADP jobs and ISM Services PMI data will offer some trading incentives.
Read: Fed Interest Rate Decision Preview: Inflation, employment and interest rates
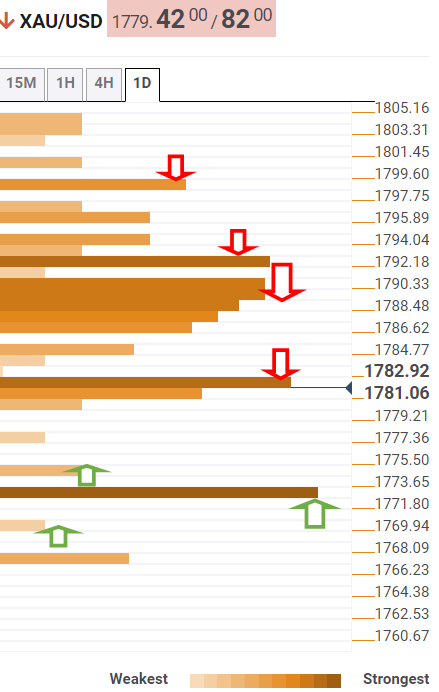
Gold Price: Key levels to watch
The Technical Confluences Detector shows that gold is on its way to test the Bollinger Band four-hour Lower support at $1777, as the downward spiral extends.
The next stop for gold bears is envisioned at $1775, the pivot point one-day S3.
The intersection of the previous week’s low and Fibonacci 61.8% one-month around $1772 will be a tough nut to crack for gold sellers.
The SMA200 four-hour at $1770 will be the line in the sand for the optimists.
On the upside, immediate resistance around $1782 will challenge the bulls. That level is the confluence of the Fibonacci 23.6% one-week, SMA50 one-day and pivot point one-day S2.
Gold buyers will then seek fresh entries above the SMA100 four-hour at $1785.
Further up, a dense cluster of healthy resistance levels between $1788-$1790 will test the bearish commitments on the road to recovery.
That zone is the convergence of the Fibonacci 23.6% one-day, Fibonacci 38.2% one-month and SMA100 one-day.
The SMA200 one-day at $1793 will offer additional resistance, above which the Fibonacci 23.6% one-month at $1799 will be eyed.
Here is how it looks on the tool
About Technical Confluences Detector
The TCD (Technical Confluences Detector) is a tool to locate and point out those price levels where there is a congestion of indicators, moving averages, Fibonacci levels, Pivot Points, etc. If you are a short-term trader, you will find entry points for counter-trend strategies and hunt a few points at a time. If you are a medium-to-long-term trader, this tool will allow you to know in advance the price levels where a medium-to-long-term trend may stop and rest, where to unwind positions, or where to increase your position size.


© 2000-2026. All rights reserved.
This site is managed by Teletrade D.J. LLC 2351 LLC 2022 (Euro House, Richmond Hill Road, Kingstown, VC0100, St. Vincent and the Grenadines).
The information on this website is for informational purposes only and does not constitute any investment advice.
The company does not serve or provide services to customers who are residents of the US, Canada, Iran, The Democratic People's Republic of Korea, Yemen and FATF blacklisted countries.
Making transactions on financial markets with marginal financial instruments opens up wide possibilities and allows investors who are willing to take risks to earn high profits, carrying a potentially high risk of losses at the same time. Therefore you should responsibly approach the issue of choosing the appropriate investment strategy, taking the available resources into account, before starting trading.
Use of the information: full or partial use of materials from this website must always be referenced to TeleTrade as the source of information. Use of the materials on the Internet must be accompanied by a hyperlink to teletrade.org. Automatic import of materials and information from this website is prohibited.
Please contact our PR department if you have any questions or need assistance at pr@teletrade.global.
transfers