- Analytics
- News and Tools
- Market News
- Gold Price Forecast: XAU/USD bulls stay hopeful while above key $1,850 support – Confluence Detector
Gold Price Forecast: XAU/USD bulls stay hopeful while above key $1,850 support – Confluence Detector
- Gold price rebounds as yields pare gains, DXY rally could limit the upside.
- Gold bulls remain motivated as long as the key $1,850 support holds.
- Gold capitalizes on inflation fears, buyers look to retain control.
Having failed several attempts to resist above the $1,870 threshold, gold price continues to hover in a familiar range above the critical $1,850 support. The latest uptick in gold price can be attributed to a sharp sell-off in the US Treasury yields, as the risk sentiment sour amid inflation and coronavirus concerns. However, strengthening US economic recovery calls for earlier Fed’s tightening, boosting the US dollar, which could limit gold’s upside.
Read: Investors expect high inflation, golden inquisition ahead?
Gold Price: Key levels to watch
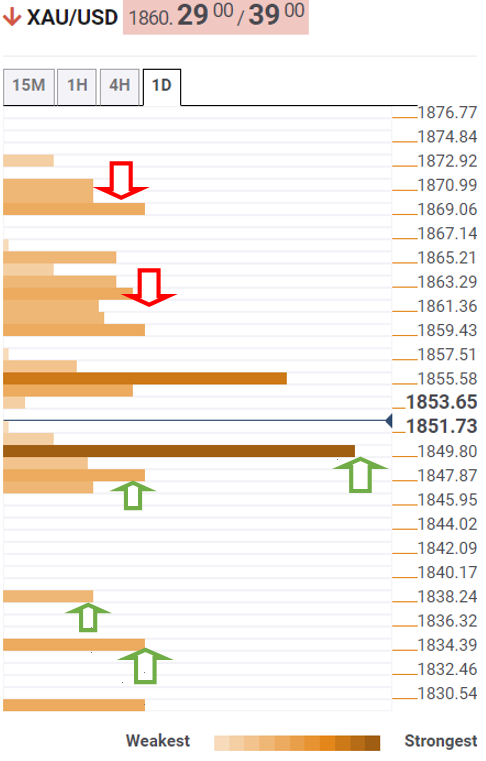
The Technical Confluences Detector shows that gold price staged a solid rebound from ahead of the key $1,850 support, which is the convergence of the pivot point one-month R2 and SMA10 one-day.
If that cap is taken out on a sustained basis, then gold bears will test minor support at $1,847, the Fibonacci 38.2% one-week.
A steep drop towards the pivot point one-day S3 at $1,839 cannot be ruled out should the abovementioned support fail to hold.
The Fibonacci 61.8% one-week at $1,834 will be the line in the sand for gold bulls.
Alternatively, gold buyers need to find a strong foothold above a dense cluster of resistance levels around the $1,863-$1,865 region.
That level is the intersection of the SMA100 one-hour, Fibonacci 38.2% one-day and SMA10 four-hour.
Further up, the previous week’s high of $1,869 will get retested.
Here is how it looks on the tool
About Technical Confluences Detector
The TCD (Technical Confluences Detector) is a tool to locate and point out those price levels where there is a congestion of indicators, moving averages, Fibonacci levels, Pivot Points, etc. If you are a short-term trader, you will find entry points for counter-trend strategies and hunt a few points at a time. If you are a medium-to-long-term trader, this tool will allow you to know in advance the price levels where a medium-to-long-term trend may stop and rest, where to unwind positions, or where to increase your position size.


© 2000-2026. All rights reserved.
This site is managed by Teletrade D.J. LLC 2351 LLC 2022 (Euro House, Richmond Hill Road, Kingstown, VC0100, St. Vincent and the Grenadines).
The information on this website is for informational purposes only and does not constitute any investment advice.
The company does not serve or provide services to customers who are residents of the US, Canada, Iran, The Democratic People's Republic of Korea, Yemen and FATF blacklisted countries.
Making transactions on financial markets with marginal financial instruments opens up wide possibilities and allows investors who are willing to take risks to earn high profits, carrying a potentially high risk of losses at the same time. Therefore you should responsibly approach the issue of choosing the appropriate investment strategy, taking the available resources into account, before starting trading.
Use of the information: full or partial use of materials from this website must always be referenced to TeleTrade as the source of information. Use of the materials on the Internet must be accompanied by a hyperlink to teletrade.org. Automatic import of materials and information from this website is prohibited.
Please contact our PR department if you have any questions or need assistance at pr@teletrade.global.
transfers