- Analytics
- News and Tools
- Market News
- Gold Price Forecast: XAU/USD needs to crack $1,820 for meaningful recovery – Confluence Detector
Gold Price Forecast: XAU/USD needs to crack $1,820 for meaningful recovery – Confluence Detector
- Gold price licks its wound amid a pause in the US Treasury yields rally.
- US dollar tracks yields pullback amid a risk-off market environment.
- Gold 2022 Outlook: Correlation with US T-bond yields to drive yellow metal.
The price action around gold remains driven by the US Treasury yields and the dollar, as the narrative of aggressive Fed’s tightening of its monetary policy remains in play. The benchmark US 10-year yields ease from a new two-year high near $1.90%. The prevalent risk-off market mood also aids the rebound in gold price. Investors continue to fret over the outlook for Fed rate hikes. The Fed speculation and US housing data will be closely followed for a fresh trading impetus on gold price.
Read: Gold Price Forecast: XAU/USD eyes additional declines amid firmer yields, $1,806 support holds the key
Gold Price: Key levels to watch
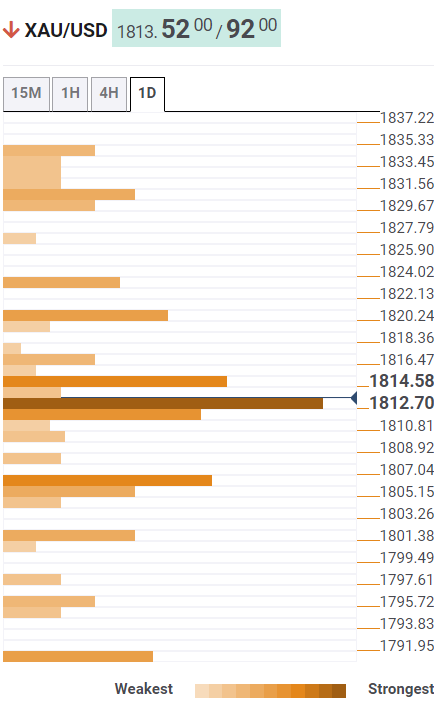
The Technical Confluences Detector shows that the gold price is struggling to extend the bounce above a strong hurdle around $1,814, which is the convergence of the Fibonacci 38.2% one-day, Fibonacci 23.6% one-month and SMA200 one-hour.
A firm breakthrough the latter could fuel a fresh upswing towards $1,820, the confluence of the SMA5 one-day and Fibonacci 23.6% one-week.
Further up, the previous day’s high of $1,823 will challenge the recovery. At that level, the pivot point one-day R1 coincides.
On the flip side, powerful cushion is seen around $1,807, the point of intersection of the Fibonacci 61.8% one-week, the previous day’s low and pivot point one-day S1.
The additional downside will call for a test of the Fibonacci 38.2% one-month at $1,800.
The pivot point one-week S1 at $1,795 will be the level to beat for gold bears.
Here is how it looks on the tool
About Technical Confluences Detector
The TCD (Technical Confluences Detector) is a tool to locate and point out those price levels where there is a congestion of indicators, moving averages, Fibonacci levels, Pivot Points, etc. If you are a short-term trader, you will find entry points for counter-trend strategies and hunt a few points at a time. If you are a medium-to-long-term trader, this tool will allow you to know in advance the price levels where a medium-to-long-term trend may stop and rest, where to unwind positions, or where to increase your position size.


© 2000-2026. All rights reserved.
This site is managed by Teletrade D.J. LLC 2351 LLC 2022 (Euro House, Richmond Hill Road, Kingstown, VC0100, St. Vincent and the Grenadines).
The information on this website is for informational purposes only and does not constitute any investment advice.
The company does not serve or provide services to customers who are residents of the US, Canada, Iran, The Democratic People's Republic of Korea, Yemen and FATF blacklisted countries.
Making transactions on financial markets with marginal financial instruments opens up wide possibilities and allows investors who are willing to take risks to earn high profits, carrying a potentially high risk of losses at the same time. Therefore you should responsibly approach the issue of choosing the appropriate investment strategy, taking the available resources into account, before starting trading.
Use of the information: full or partial use of materials from this website must always be referenced to TeleTrade as the source of information. Use of the materials on the Internet must be accompanied by a hyperlink to teletrade.org. Automatic import of materials and information from this website is prohibited.
Please contact our PR department if you have any questions or need assistance at pr@teletrade.global.
transfers