- Analytics
- News and Tools
- Market News
- EUR/USD Forecast: Euro recovery likely to be capped at 1.1040
EUR/USD Forecast: Euro recovery likely to be capped at 1.1040
Original content: EUR/USD Forecast: Euro recovery likely to be capped at 1.1040
- EUR/USD has regained its traction after dropping to two-week lows.
- The pair could find it difficult to clear the 1.1040 hurdle.
- Eyes on Russia-Ukraine talks, US consumer confidence data.
EUR/USD has reversed its direction after having touched its weakest level in two weeks at 1.0944 on Monday. The pair is holding above 1.1000 in the early European session but it could find it difficult to break above the 1.1040 resistance.
The improving market mood is not allowing the greenback to gather strength early Tuesday and helping EUR/USD clings to its recovery gains.
Markets are hopeful that Russia and Ukraine will make progress toward a cease-fire at Tuesday's talks. Reflecting the risk-positive market environment, the Euro Stoxx 600 Index is rising more than 1% on a daily basis and US stock index futures are up between 0.2% and 0.3%.
In case the headlines coming out of the Russia-Ukraine negotiations convince market participants that there will not be a further escalation of the conflict, risk flows could continue to provide a boost to the shared currency.
In the second half of the day, the Conference Board will release the US Consumer Confidence report for March. Several FOMC policymakers, including NY Fed President John Williams and Atlanta Fed President Raphael Bostic, will be delivering speeches as well.
The latest remarks from Fed officials fueled expectations of a 50 basis points rate hike in May and triggered a rally in the US T-bond yields. The fundamental outlook highlighted by the policy divergence between the Fed and the ECB should continue to favour the dollar over the euro, suggesting that the pair's recovery attempts are likely to remain technical in the near term.
EUR/USD Technical Analysis
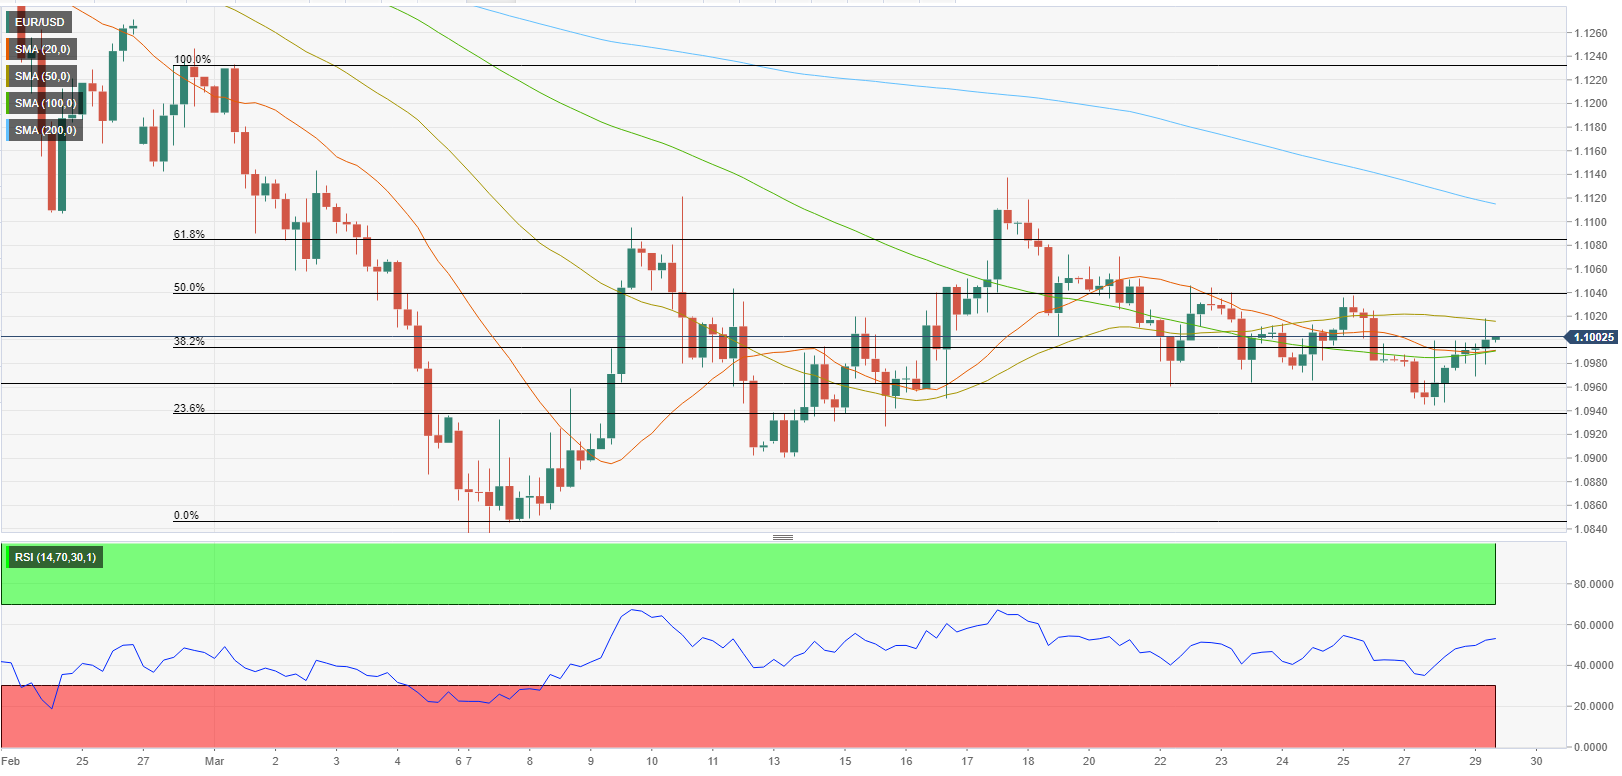
EUR/USD is trading above the 100-period SMA on the four-hour chart. Confirming the bullish tilt in the technical picture, the Relative Strength Index (RSI) indicator is edging higher above 50 on the same chart.
On the upside, 1.1020 (50-period SMA) aligns as interim resistance ahead of 1.1040 (Fibonacci 50% retracement of the latest downtrend). In case the latter turns into support, the next bullish target could be seen at 1.1080 (Fibonacci 61.8% retracement).
On the other hand, immediate support is located at 1.1000 (psychological level, Fibonacci 38.2% retracement, 100-period SMA) before 1.0960 (static level) and 1.0940 (Fibonacci 23.6% retracement).


© 2000-2026. All rights reserved.
This site is managed by Teletrade D.J. LLC 2351 LLC 2022 (Euro House, Richmond Hill Road, Kingstown, VC0100, St. Vincent and the Grenadines).
The information on this website is for informational purposes only and does not constitute any investment advice.
The company does not serve or provide services to customers who are residents of the US, Canada, Iran, The Democratic People's Republic of Korea, Yemen and FATF blacklisted countries.
Making transactions on financial markets with marginal financial instruments opens up wide possibilities and allows investors who are willing to take risks to earn high profits, carrying a potentially high risk of losses at the same time. Therefore you should responsibly approach the issue of choosing the appropriate investment strategy, taking the available resources into account, before starting trading.
Use of the information: full or partial use of materials from this website must always be referenced to TeleTrade as the source of information. Use of the materials on the Internet must be accompanied by a hyperlink to teletrade.org. Automatic import of materials and information from this website is prohibited.
Please contact our PR department if you have any questions or need assistance at pr@teletrade.global.
transfers