- Analytics
- News and Tools
- Market News
- Gold Price Forecast: XAU/USD retreats from $1950 on US dollar strength, high US yields
Gold Price Forecast: XAU/USD retreats from $1950 on US dollar strength, high US yields
- Gold slumps for the third day of the week amid an upbeat market mood and rising US yields.
- The 2s-10s yield curve inverted for the second time in the week as investors expect the US economy will slow down.
- Mixed US economic data was mainly ignored by XAU/USD traders.
- XAU/USD Price Forecast: In consolidation within the $1900-50 range.
Gold (XAU/USD) slides as the second quarter begins, down some 0.64% in the North American session. The Russia-Ukraine tussles, elevated global inflation, and rising US Treasury yields, keeping the non-yielding metal pressured. Nevertheless, an inversion in the 2s-10s yield curve is worth noting as investors assess the outcome for the yellow metal. At press time, XAU/USD is trading at $1924.46 a troy ounce.
Upbeat market sentiment and positive US economic data weighed on gold
US equities fluctuate as Wall Street is about to close; meanwhile, European bourses finished positive. The Russia-Ukraine war extends as peace talks over the last couple of weeks have failed to offer a diplomatic exit to the war. Furthermore, Russia’s President Vladimir Putin puts pressure on Europe after signing a decree that non-friendly countries need to pay in roubles for natural gas.
That triggered a raft of negative market moods on Thursday, which lifted gold towards $1950. Nonetheless, positive US economic data weighed on gold prices.
The US economic docket featured March’s Nonfarm Payrolls report, which came at 431K jobs created, lower than the 490K estimated by analysts. Even though it was slightly softer than expected, forecasts ranged from 0 to 700K, so the market perceived it as a robust report. Moreover, the Unemployment rate in March dropped to 3.6% from 3.8% YoY in and beat the 3.7% estimations.
Later the US ISM Manufacturing PMI, a leading indicator for the industry, fell to 57.1 in March from 58.6 in February, well below the 59 estimations by analysts.
Meanwhile, the US Dollar Index, a gauge of the greenback’s value against a basket of its rivals, rose 0.22%, sitting at 98.566, underpinned by US Treasury yields. The US 10-year benchmark note surges four basis points at 2.371%.
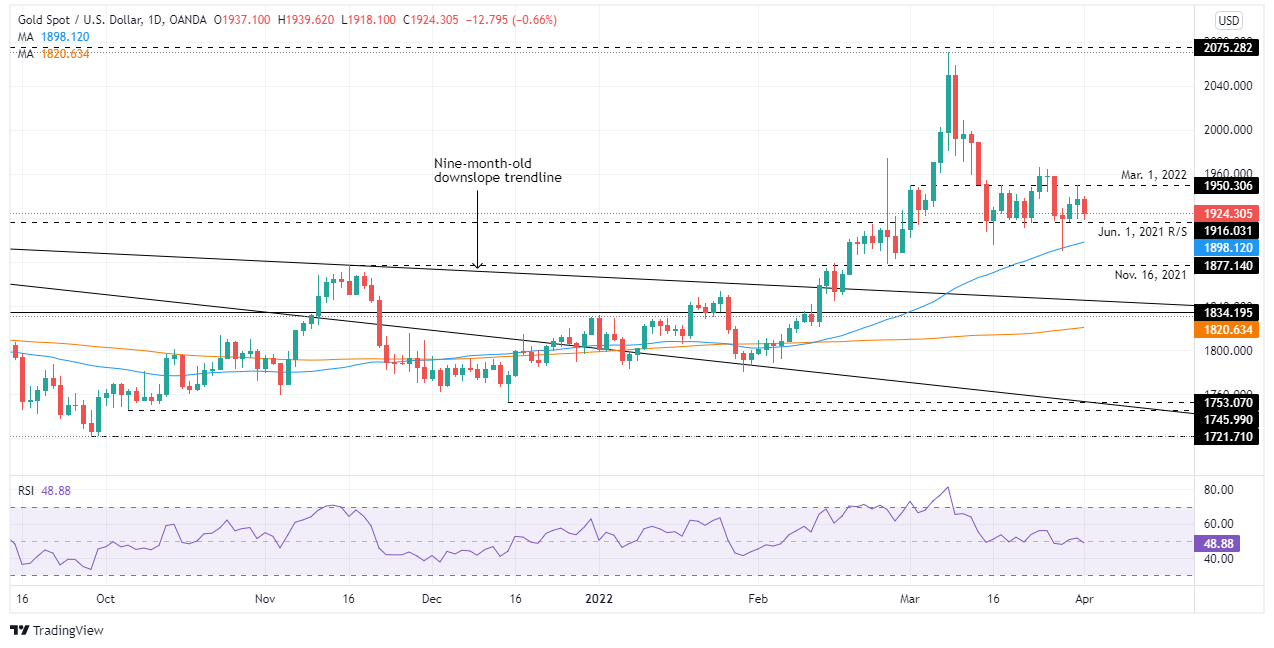
XAU/USD Price Forecast: Technica outlook
XAU/USD is trading within the $1910-50 range for thirteen consecutive days, consolidated and with a lack of direction. The Relative Strength Index (RSI), a momentum indicator, has been seesawing around the 50-midline but on Friday turned bearish at 48.71. However, the daily moving averages (DMAs) below the spot price depict an upward bias, but contradictory signals recommended to wait for a fresh catalyst.
Upwards, XAU/USD’s first resistance would be March 1 daily high at $1950.30. Breach of the latter would expose March 24 daily high at $1966.20, followed by $2000.
On the flip side, the XAU/USD first support would be $1910. A clear break would expose the 50-day moving average (DMA) at $1898.11, followed by November 16, 2021, daily high at $1877.14, followed by the 200-DMA at $1820.63.


© 2000-2026. All rights reserved.
This site is managed by Teletrade D.J. LLC 2351 LLC 2022 (Euro House, Richmond Hill Road, Kingstown, VC0100, St. Vincent and the Grenadines).
The information on this website is for informational purposes only and does not constitute any investment advice.
The company does not serve or provide services to customers who are residents of the US, Canada, Iran, The Democratic People's Republic of Korea, Yemen and FATF blacklisted countries.
Making transactions on financial markets with marginal financial instruments opens up wide possibilities and allows investors who are willing to take risks to earn high profits, carrying a potentially high risk of losses at the same time. Therefore you should responsibly approach the issue of choosing the appropriate investment strategy, taking the available resources into account, before starting trading.
Use of the information: full or partial use of materials from this website must always be referenced to TeleTrade as the source of information. Use of the materials on the Internet must be accompanied by a hyperlink to teletrade.org. Automatic import of materials and information from this website is prohibited.
Please contact our PR department if you have any questions or need assistance at pr@teletrade.global.
transfers