- Analytics
- News and Tools
- Market News
- Gold Price Forecast: XAU/USD downside opening up towards $1,817 – Confluence Detector
Gold Price Forecast: XAU/USD downside opening up towards $1,817 – Confluence Detector
- Gold Price extends the previous sell-off, with more pain in the offing.
- Hawkish Fedspeak, pre-US inflation anxiety boost the USD despite falling yields.
- Gold Price Forecast: On its way to challenging the $1,800 threshold.
Gold Price is testing the critical support, licking its wounds near three-months troughs below $1,850. The resurgent US dollar haven demand amid looming global growth and inflation fears weighed negatively on Gold Price, as traders ignored the pullback in the Treasury yields from multi-year highs. Additionally, hawkish Fedspeak also boosted the US dollar, exacerbating the pain in XAU/USD. Attention turns towards the critical US inflation release for a fresh direction in Gold Price.
Also read: US April CPI Preview: Has inflation peaked?
Gold Price: Key levels to watch
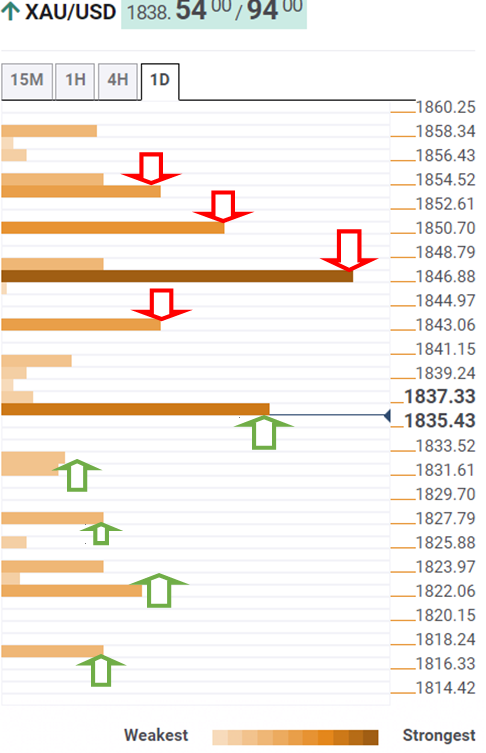
The Technical Confluences Detector shows that the Gold Price is testing the bullish commitments at critical support of $1,836. At that level, the SMA200 one-day, the previous day’s low and SMA5 one-hour coincide.
The next relevant support awaits at the previous low four-hour at $1,833, below which a fresh drop towards the pivot point one-day S1 at $1,827 cannot be ruled out.
Further down, sellers will target the pivot point one-week S2 at $1,822. The last line of defense for gold bulls is seen at $1,817, the pivot point one-day S2.
On the upside, any recovery could gain momentum only on a sustained break above the previous high four-hour at $1,841, above which the Fibonacci 23.6% one-day could be tested.
The confluence of the pivot point one-month S1 and Fibonacci 38.2% one-day at $1,847 will come into play.
The previous week’s low at $1,850 could be also on the buyers’ radars, opening gates towards $1,853, the intersection of the Fibonacci 61.8% one-day and pivot point one-week S1.
Here is how it looks on the tool
About Technical Confluences Detector
The TCD (Technical Confluences Detector) is a tool to locate and point out those price levels where there is a congestion of indicators, moving averages, Fibonacci levels, Pivot Points, etc. If you are a short-term trader, you will find entry points for counter-trend strategies and hunt a few points at a time. If you are a medium-to-long-term trader, this tool will allow you to know in advance the price levels where a medium-to-long-term trend may stop and rest, where to unwind positions, or where to increase your position size.


© 2000-2026. All rights reserved.
This site is managed by Teletrade D.J. LLC 2351 LLC 2022 (Euro House, Richmond Hill Road, Kingstown, VC0100, St. Vincent and the Grenadines).
The information on this website is for informational purposes only and does not constitute any investment advice.
The company does not serve or provide services to customers who are residents of the US, Canada, Iran, The Democratic People's Republic of Korea, Yemen and FATF blacklisted countries.
Making transactions on financial markets with marginal financial instruments opens up wide possibilities and allows investors who are willing to take risks to earn high profits, carrying a potentially high risk of losses at the same time. Therefore you should responsibly approach the issue of choosing the appropriate investment strategy, taking the available resources into account, before starting trading.
Use of the information: full or partial use of materials from this website must always be referenced to TeleTrade as the source of information. Use of the materials on the Internet must be accompanied by a hyperlink to teletrade.org. Automatic import of materials and information from this website is prohibited.
Please contact our PR department if you have any questions or need assistance at pr@teletrade.global.
transfers