- Analytics
- News and Tools
- Market News
- USD/JPY Price Analysis: Bears have taken control, eye weekly 38.2% Fibo near 125.00
USD/JPY Price Analysis: Bears have taken control, eye weekly 38.2% Fibo near 125.00
- USD/JPY bears are taking control and eye a run to 125 the figure for the days ahead.
- The four-hour outlook is bullish for the immediate hours as the price corrects towards a 38.2% Fibo.
As per the prior series of analyses, USD/JPY embarks on a significant correction below key daily support, and before that, USD/JPY Price Analysis: Bulls meeting tough resistance from bears despite bull flag, the price is moving in accordance with the bearish outlook and the following illustrates the before, now and possibilities for the forthcoming sessions and days ahead.
USD/JPY prior analysis
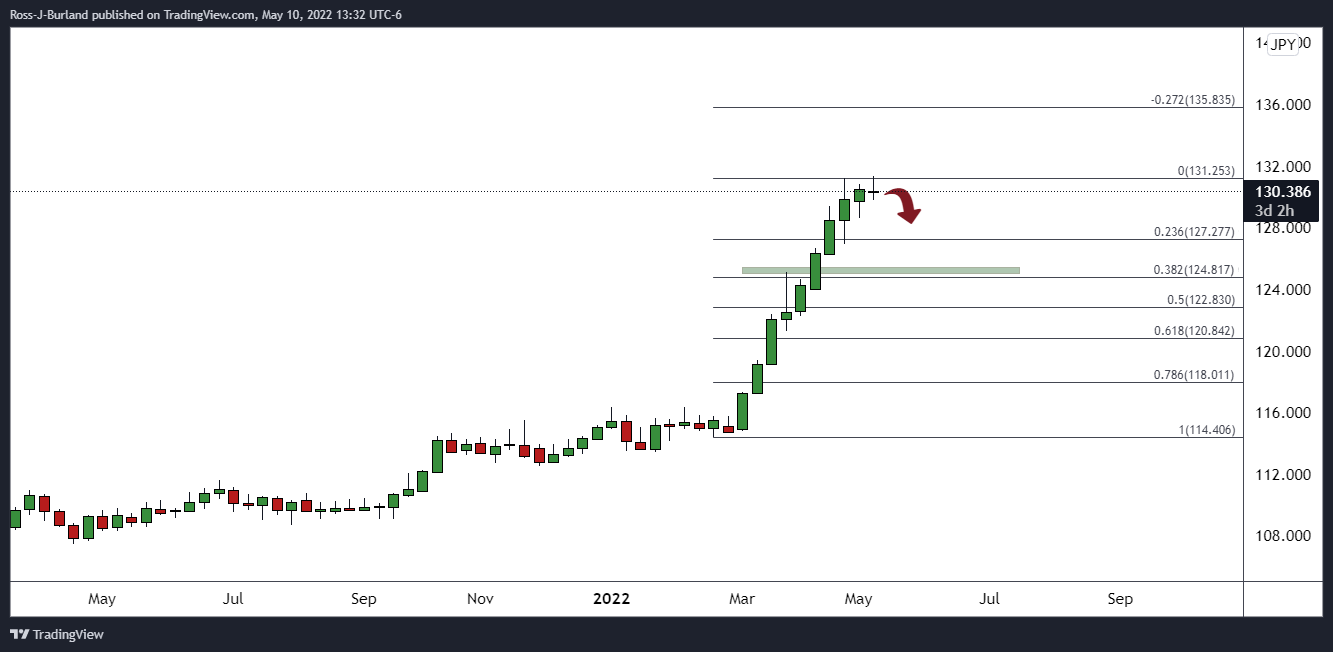
From a weekly perspective, the price was potentially overstretched and due for a correction. On the daily chart, the price had formed a W-formation which pulled in the bids and offers started to emerge:
The bull flag breakout failed:
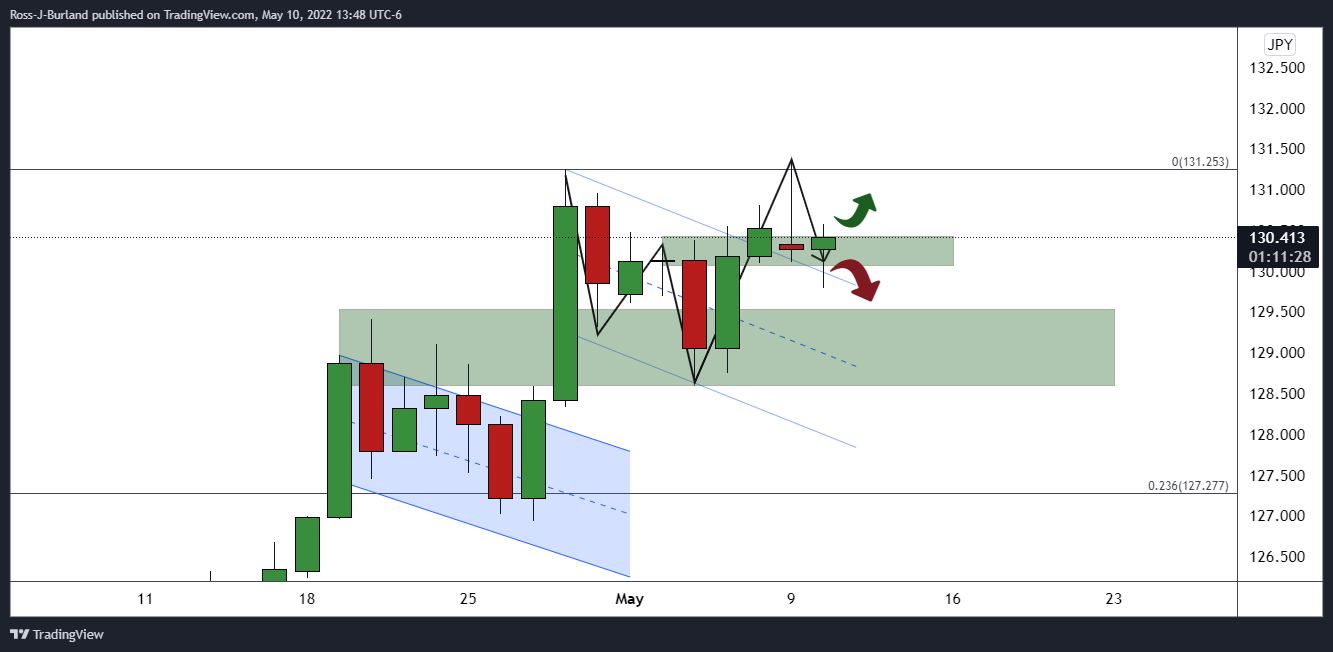
The pair had bucked the trend last Thursday, breaking below prior support and denied the bulls that were otherwise seeking more from the bullish flag pattern on the daily chart:
The price action had left an M-formation on the daily chart, the opposite of the prior W-formation. These patterns often see the price reverting to restest the prior lows or the neckline of the chart pattern. In this case, the neckline was near 129.80.
USD/JPY live market
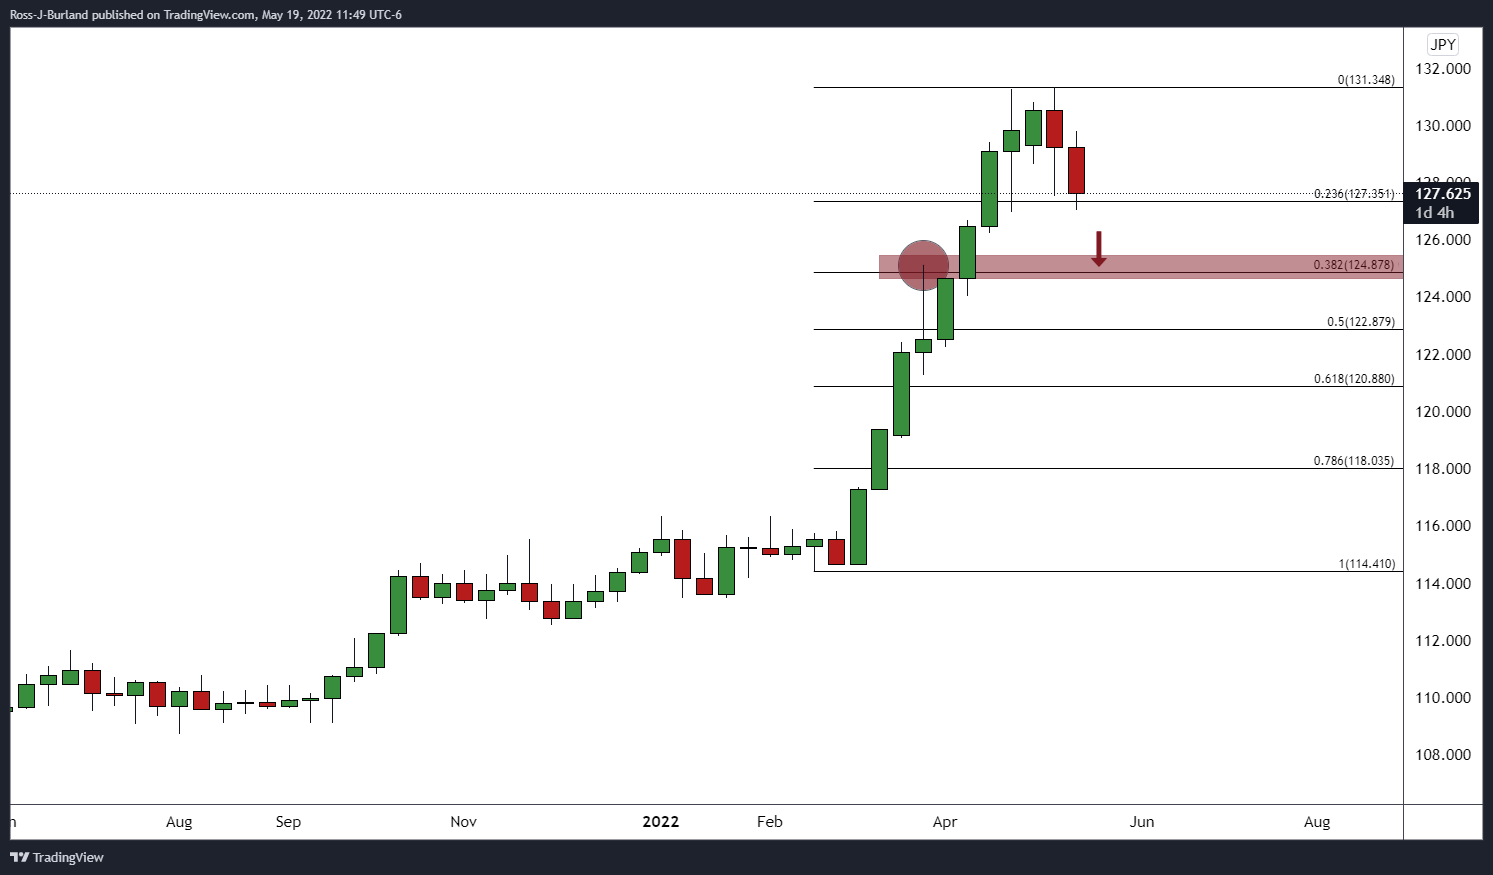
The weekly correction is well and truly underway with eyes on a break of 127 the figure and then the 38.2% Fibonacci retracement that aligns with prior highs made in Feb near 125.00.
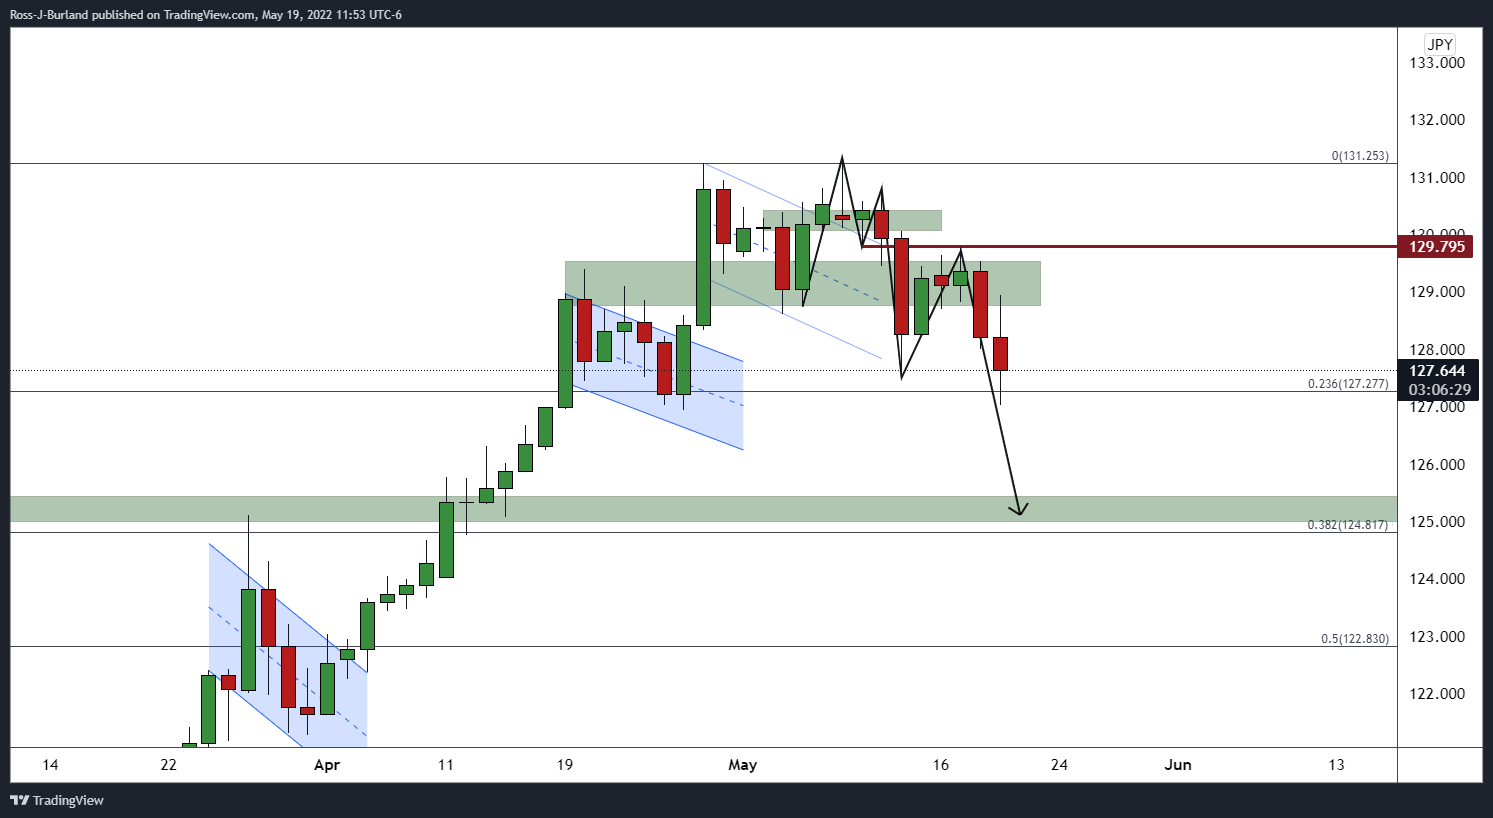
The daily chart has seen the price revert to test the neckline of the M-formation at 129.795 and has since moved lower in a downside continuation.
However, another M-formation has been left:
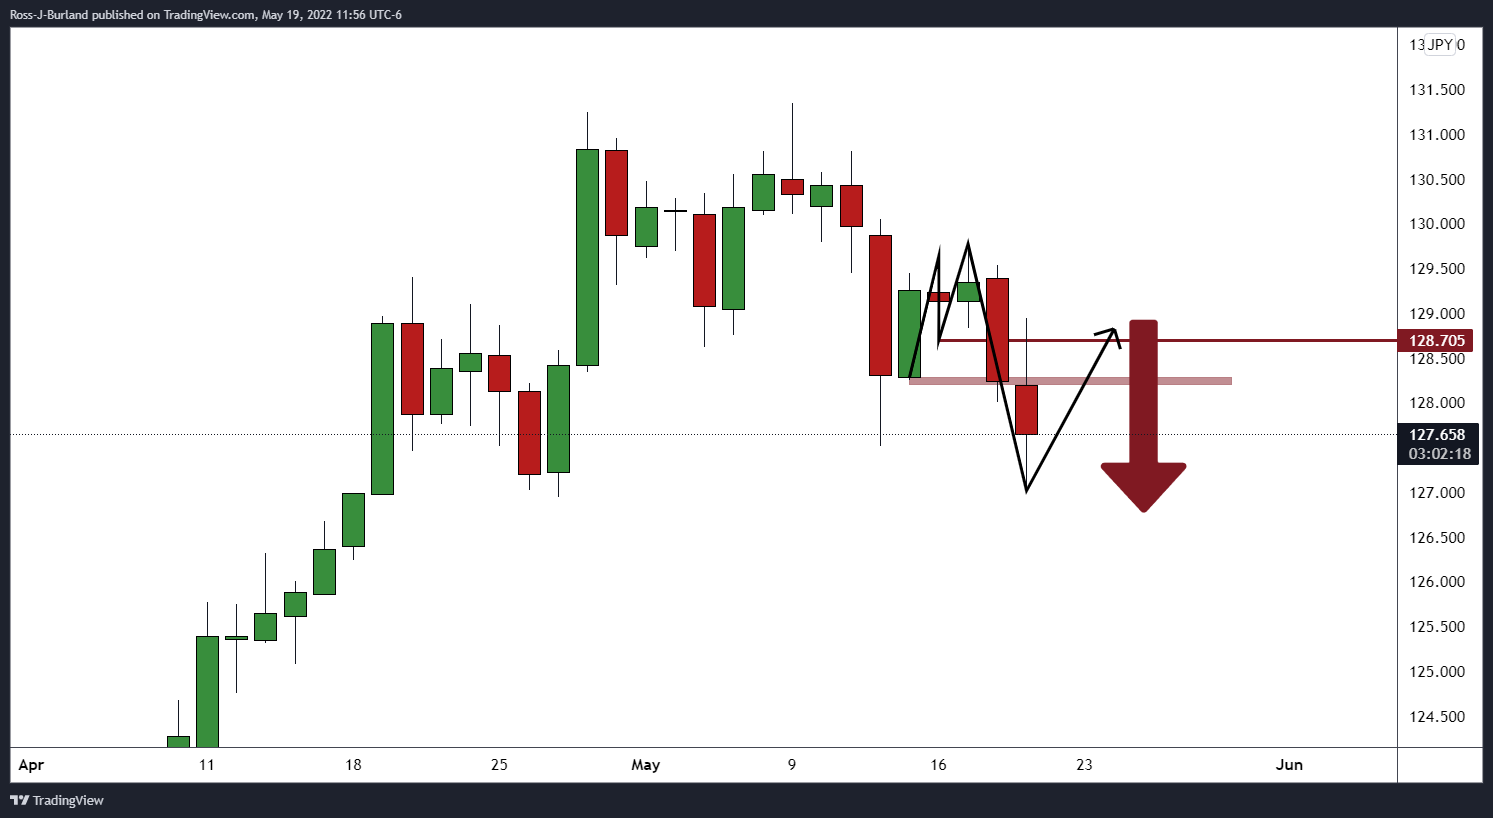
Whether the bears commit now on a daily basis having already forced back the bears from the neckline at 128.705, or if the price needs to close on a daily basis into the neckline, the outlook is still bearish.
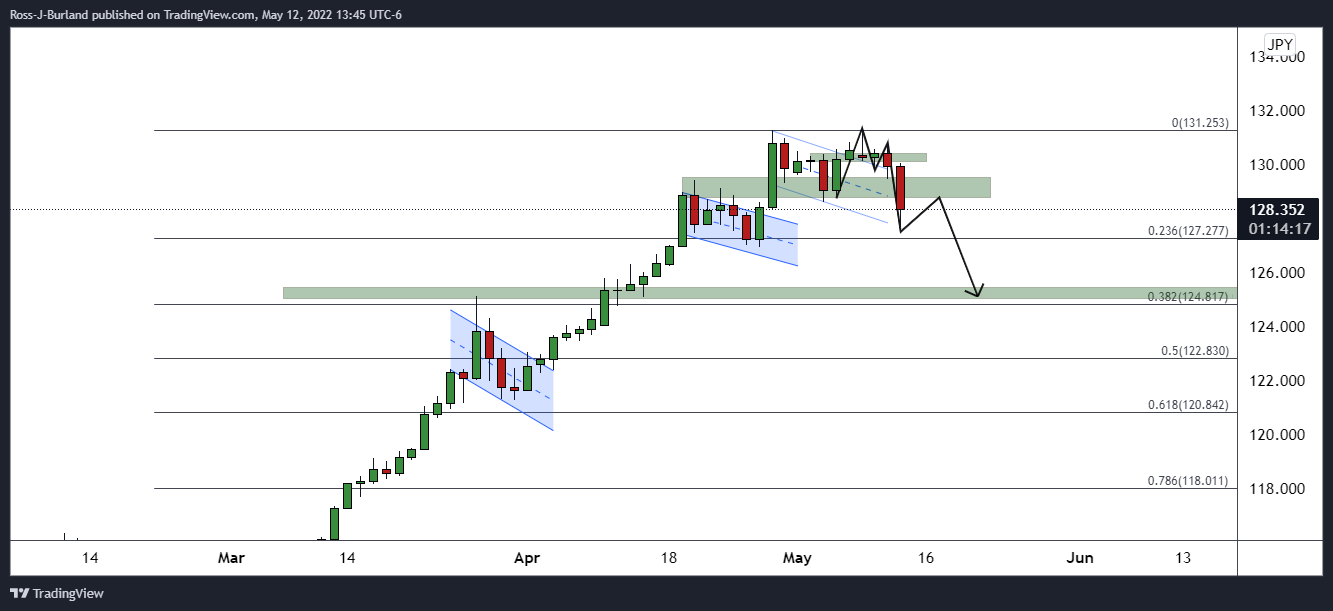
USD/JPY H4 chart
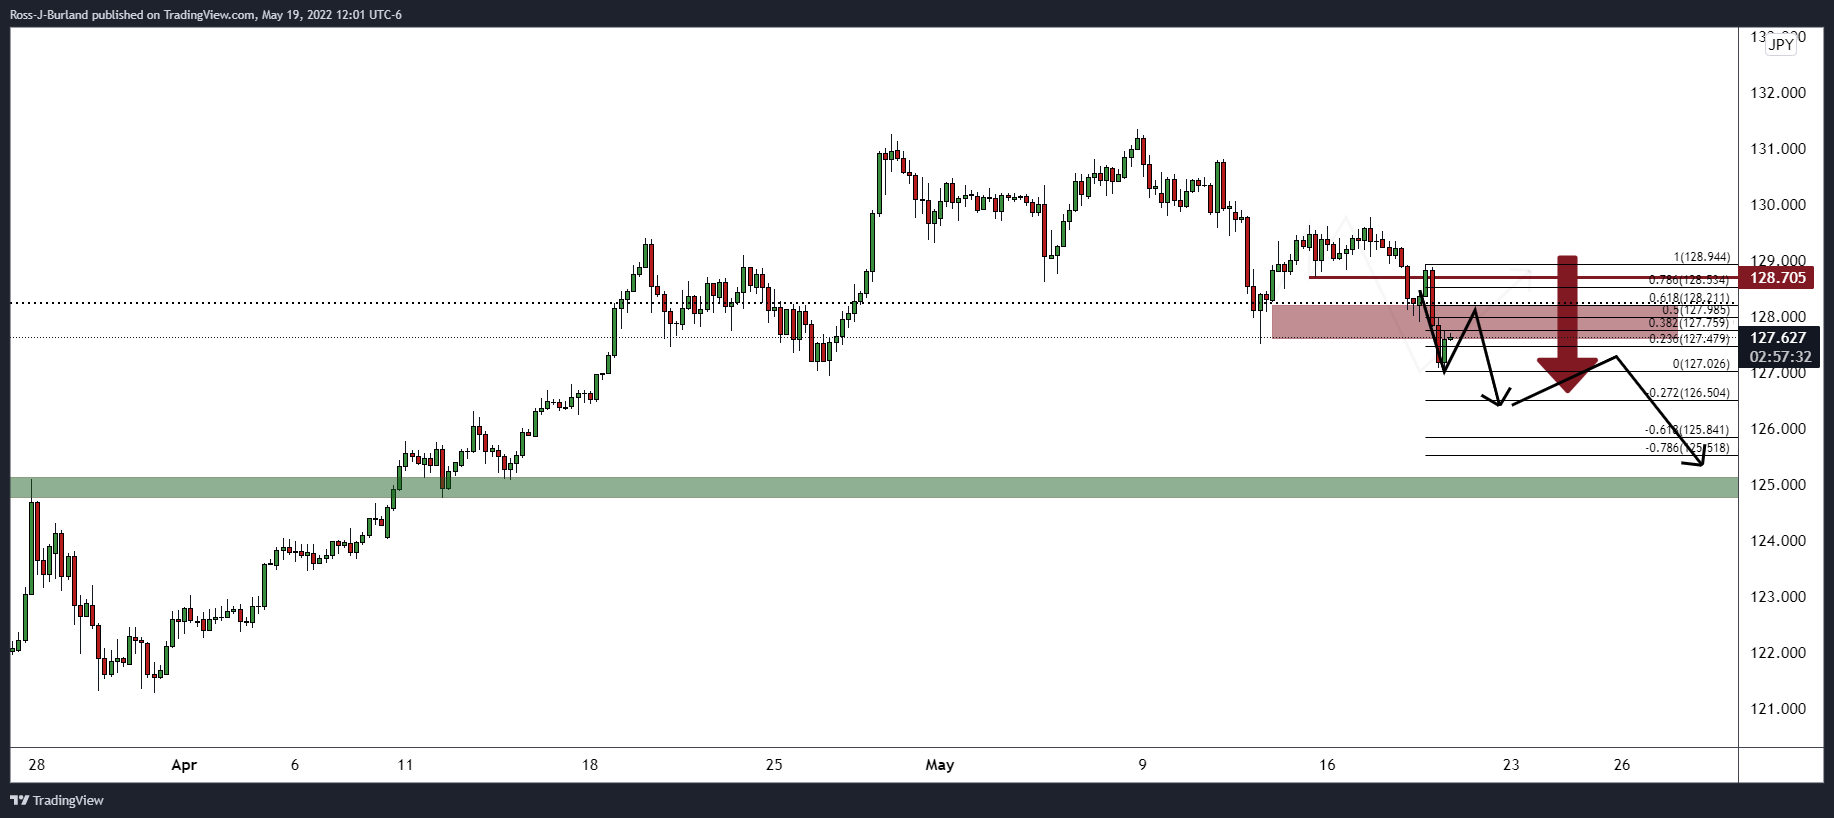
The four-hour outlook is bullish for the immediate hours as the price corrects towards a 38.2% Fibo and to test the resistance structure. If the bears commit between here and the 61.8% ratio near 128.20, then there will be scope for a downside continuation and fresh corrective low for the days ahead. A break of 126.50 will be required in order to clear the way toward the weekly 38.2% ratio target nearer 125 the figure. On the flipside, 128.705 is a key resistance that could be the ultimate defence of a bullish continuation.


© 2000-2026. All rights reserved.
This site is managed by Teletrade D.J. LLC 2351 LLC 2022 (Euro House, Richmond Hill Road, Kingstown, VC0100, St. Vincent and the Grenadines).
The information on this website is for informational purposes only and does not constitute any investment advice.
The company does not serve or provide services to customers who are residents of the US, Canada, Iran, The Democratic People's Republic of Korea, Yemen and FATF blacklisted countries.
Making transactions on financial markets with marginal financial instruments opens up wide possibilities and allows investors who are willing to take risks to earn high profits, carrying a potentially high risk of losses at the same time. Therefore you should responsibly approach the issue of choosing the appropriate investment strategy, taking the available resources into account, before starting trading.
Use of the information: full or partial use of materials from this website must always be referenced to TeleTrade as the source of information. Use of the materials on the Internet must be accompanied by a hyperlink to teletrade.org. Automatic import of materials and information from this website is prohibited.
Please contact our PR department if you have any questions or need assistance at pr@teletrade.global.
transfers