- Analytics
- News and Tools
- Market News
- USD/CHF Price Analysis: Double top in play but sellers failure at 0.9520, could spark a test of 0.9600
USD/CHF Price Analysis: Double top in play but sellers failure at 0.9520, could spark a test of 0.9600
- USD/CHF bounces off near-daily lows and stays above the 50% Fibonacci retracement in the H1 chart.
- Disappointing US economic data sparks a counter-cyclical move with the US dollar rising instead of falling.
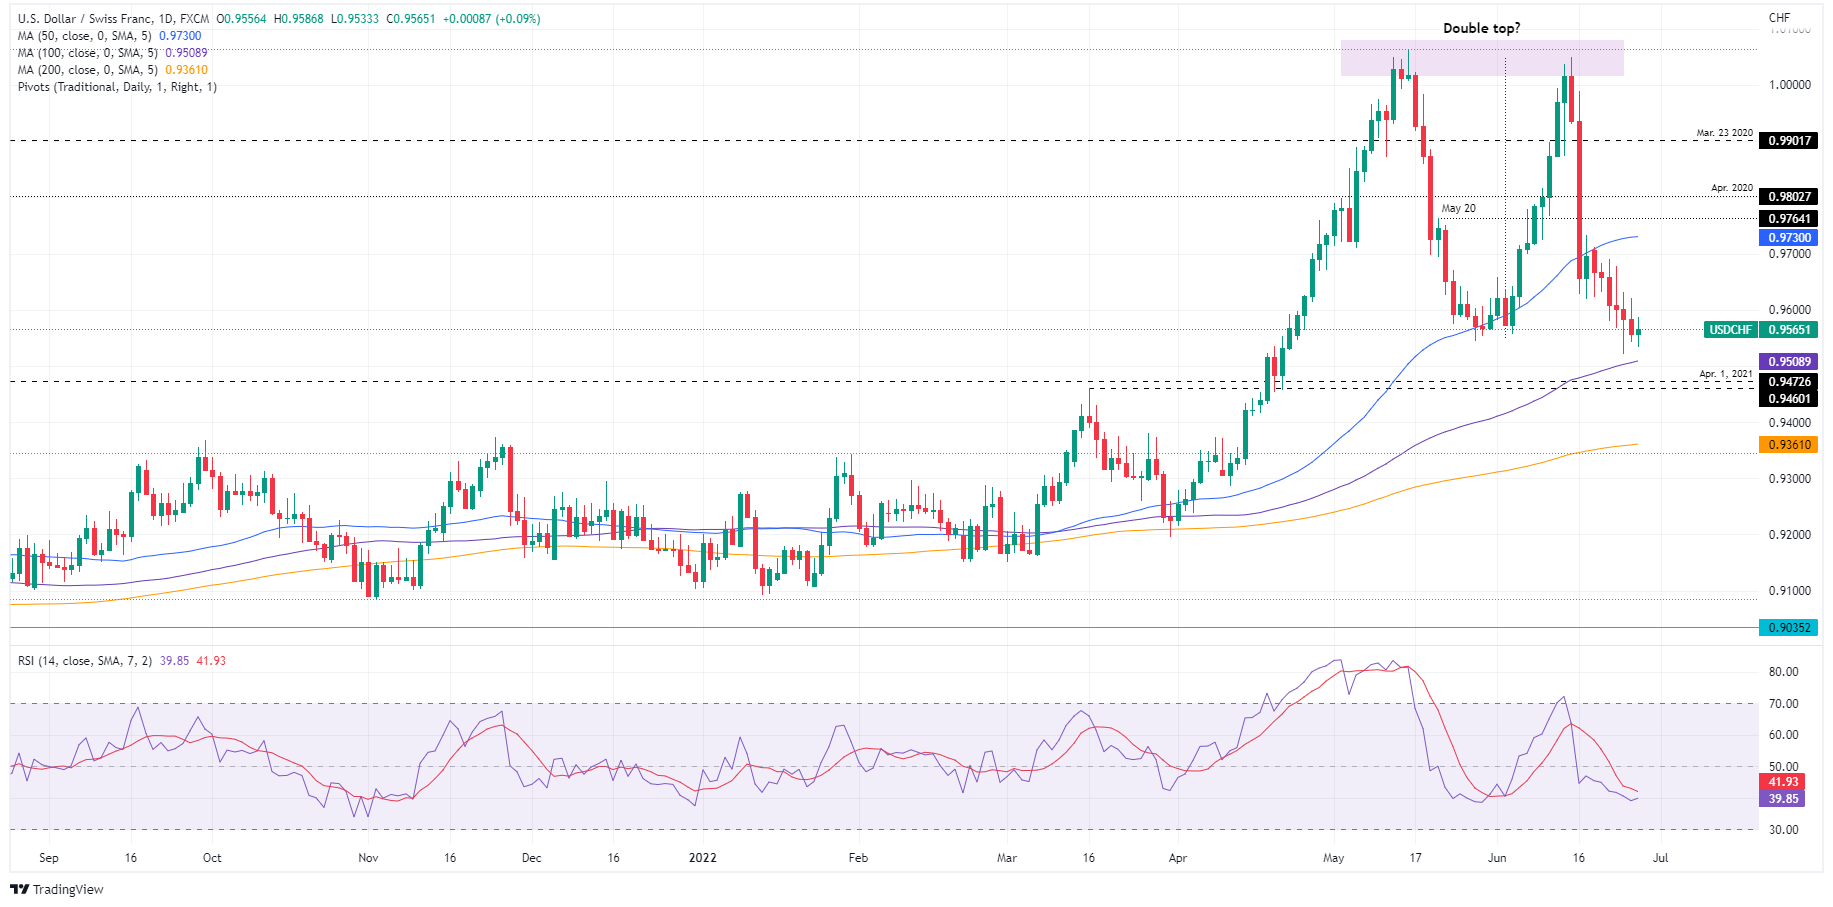
- The USD/CHF daily chart formed a double top that is in play, but USD/CHF sellers’ failures to breach 0.9520, might open the door for a rally towards 0.9600.
The USD/CHF is trying to stage a recovery after falling for six straight days, though it failed to break below the June 24 daily low of around 0.9561 and remains trapped within that day’s price action amidst the lack of a fresh impulse above/below the 0.9520-9630 range. At 0.9563, the USD/CHF advances barely by 0.07% in the North American session.
US equities are beginning to tumble as market sentiment shifted sour. During the Asian session, positive news from China that cut quarantine for travelers was overshadowed by a dismal read in US consumer confidence, triggering a counter-cyclical move in the greenback, with the US Dollar Index advancing sharply near last Friday’s high around 104.377, up by 0.42%.
USD/CHF traders should notice that negative US data from the growth perspective can sometimes boost the greenback, as is happening today.
USD/CHF Daily chart
A double top in the USD/CHF daily chart is still in play. However, since last Friday, CHF buyers could not achieve a fresh swing low, below the 0.9520-0.9630 range, keeping the major trapped. In the meantime, the Relative Strength Index (RSI) at 39.72 begins to show some signs of aiming slightly up, but unless it breaks the 50-midline, the bias remains negative, and the USD/CHF might probe the 100-day moving average (DMA) at 0.9508 in the near term.
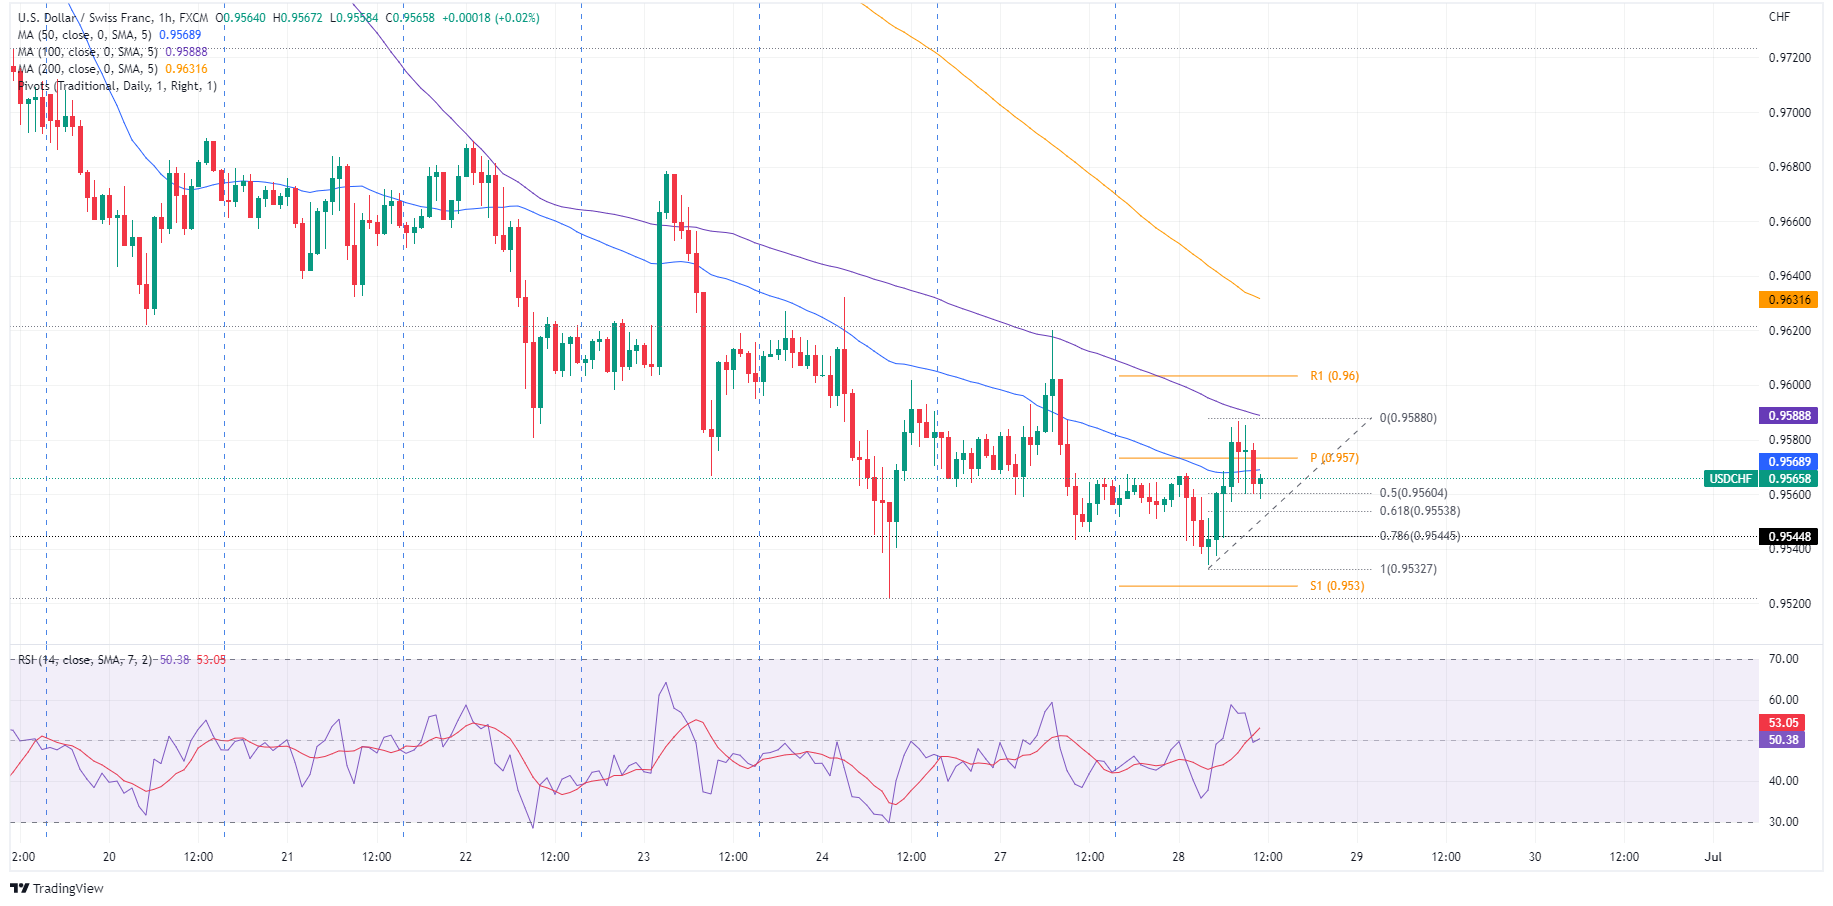
USD/CHF 1-Hour chart
The USD/CHF is seesawing around the daily pivot near 0.9573, with the 50, 100, and 200-simple moving averages (SMAs) above the exchange rate. Nevertheless, the pullback from daily highs at around 0.9586 might be short-lived, as the price jumped from around the 50% Fibonacci retracement at 0.9560 after the London fix.
If the USD/CHF breaks above the 50-SMA at 0.9568, a re-test of the daily highs is on the cards. That said, the major next resistance would be the daily pivot at 0.9573, followed by the confluence of the 100-SMA, and the daily high near 0.9586-88, followed by the R1 daily pivot at 0.9600.
USD/CHF Key Technical Levels


© 2000-2026. All rights reserved.
This site is managed by Teletrade D.J. LLC 2351 LLC 2022 (Euro House, Richmond Hill Road, Kingstown, VC0100, St. Vincent and the Grenadines).
The information on this website is for informational purposes only and does not constitute any investment advice.
The company does not serve or provide services to customers who are residents of the US, Canada, Iran, The Democratic People's Republic of Korea, Yemen and FATF blacklisted countries.
Making transactions on financial markets with marginal financial instruments opens up wide possibilities and allows investors who are willing to take risks to earn high profits, carrying a potentially high risk of losses at the same time. Therefore you should responsibly approach the issue of choosing the appropriate investment strategy, taking the available resources into account, before starting trading.
Use of the information: full or partial use of materials from this website must always be referenced to TeleTrade as the source of information. Use of the materials on the Internet must be accompanied by a hyperlink to teletrade.org. Automatic import of materials and information from this website is prohibited.
Please contact our PR department if you have any questions or need assistance at pr@teletrade.global.
transfers