- Analytics
- News and Tools
- Market News
- Gold Price Forecast: XAU/USD corrects from $1,780, upside remains favored on weaker DXY
Gold Price Forecast: XAU/USD corrects from $1,780, upside remains favored on weaker DXY
- Gold price is testing the upside break of the consolidation formed in a $1,764.45-1,775.35 range.
- A slippage in US ISM New Orders Index data indicates the downside risk of demand ahead.
- The US NFP is likely to slip to 250k from the prior release of 372k.
Gold price (XAU/USD) has corrected t near $1,774.65 after printing a high of $1,780.58 in the early Tokyo session. The precious metal is likely to rebound again as an upside break of consolidation is followed by a low-volume test of the breakout. Earlier, the bright metal displayed an upside break of the consolidation formed in a $1,764.45-1,775.35 range.
Meanwhile, the US dollar index (DXY) has found a modest rebound after refreshing the three-week low at 105.05 at the open. The DXY has shifted into a negative trajectory as forward demand by retailers and producers has trimmed significantly. The US agency reported a vulnerable US Institute of Supply Management (ISM) Manufacturing New Orders Index data on Monday.
The economic data indicates forward demand by the retailers and producers. The data remained lower than the estimates of 52 and the prior print of 49.2 at 48. A meaningful trim in the demand forecast indicator resulted in a steep fall in the DXY.
Going forward, investors’ entire focus will remain on the mega event of the US Nonfarm Payrolls (NFP), which is due on Friday. As per the market consensus, the US economy has generated 250k jobs in July lower than June’s print of 372k. This will strengthen the gold price against the greenback.
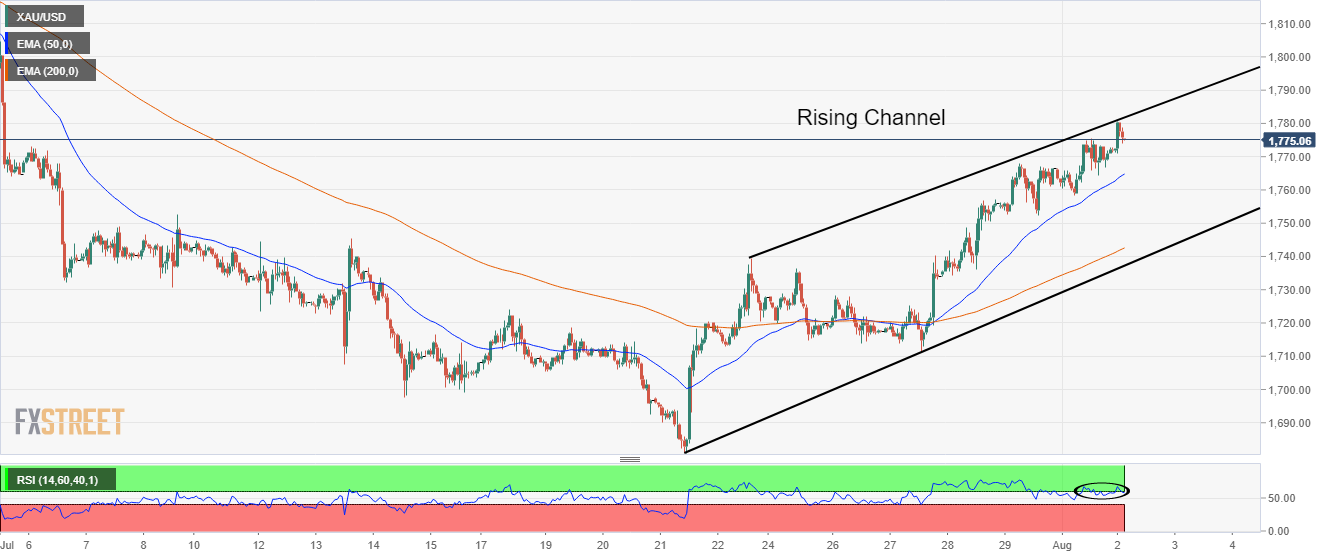
Gold technical analysis
A rising channel formation by the gold prices on an hourly scale advocates the continuation of an upside move. The upper portion of the above-mentioned chart pattern is placed from July 22 high at $1,739.37 while the lower portion is plotted from July 21 low at $1,681.87.
Advancing 50-and 200-Exponential Moving Averages (EMAs) at $1,765.40 and $1,742.85 respectively adds to the upside filters.
Meanwhile, the Relative Strength Index (RSI) (14) is attempting to reclaim 60.00 levels. An occurrence of the same will warrant a fresh bullish impulsive wave.
Gold hourly chart


© 2000-2026. All rights reserved.
This site is managed by Teletrade D.J. LLC 2351 LLC 2022 (Euro House, Richmond Hill Road, Kingstown, VC0100, St. Vincent and the Grenadines).
The information on this website is for informational purposes only and does not constitute any investment advice.
The company does not serve or provide services to customers who are residents of the US, Canada, Iran, The Democratic People's Republic of Korea, Yemen and FATF blacklisted countries.
Making transactions on financial markets with marginal financial instruments opens up wide possibilities and allows investors who are willing to take risks to earn high profits, carrying a potentially high risk of losses at the same time. Therefore you should responsibly approach the issue of choosing the appropriate investment strategy, taking the available resources into account, before starting trading.
Use of the information: full or partial use of materials from this website must always be referenced to TeleTrade as the source of information. Use of the materials on the Internet must be accompanied by a hyperlink to teletrade.org. Automatic import of materials and information from this website is prohibited.
Please contact our PR department if you have any questions or need assistance at pr@teletrade.global.
transfers