- Analytics
- News and Tools
- Market News
- Gold Price Forecast: XAU/USD plunges to $1,760 as risk-aversion returns, US ISM Services PMI eyed
Gold Price Forecast: XAU/USD plunges to $1,760 as risk-aversion returns, US ISM Services PMI eyed
- Gold price has slipped swiftly to near $1,760.00 as market mood sours on US-China tensions.
- Fed policymakers have renewed inflation fears but have trimmed the odds of a recession.
- The US ISM Services PMI is likely to remain downbeat ahead.
Gold price (XAU/USD) has shifted into a correction phase after a juggernaut rally from yearly lows near $1,680.00 on Tuesday. The precious metal has plunged to near $1,760.00 as investors preferred the US dollar index (DXY) a better investment option after the market sentiment turned sour. The visit of US House Speaker Nancy Pelosi to Taiwan to support their local government despite the threat attempts of China spurred the risk-aversion theme.
The underpinned risk-aversion theme sent the risk-perceived currencies into the negative trajectory and improved the DXY’s appeal. The DXY displayed a sheer responsive buying action and reclaimed the crucial hurdle of 106.00. The asset extended its recovery and printed a high of 106.35 after commentary from Federal Reserve (Fed) policymakers.
Chicago Fed President Charles Evans dictated that the inflationary pressures are broadening out and favored a 50 basis point (bps) interest rate hike in September. While Cleveland Fed President Loretta Mester trimmed recession fears citing that the labor market is rock solid, however, price pressures have not decreased at all.
In today’s session, the entire focus will remain on the US ISM Services PMI data. A preliminary estimate for the economic data is 53.5, significantly lower than the prior release of 55.3. The US ISM Services New Orders Index data will be worth watching as US techs have lowered their guidance for the rest of the year.
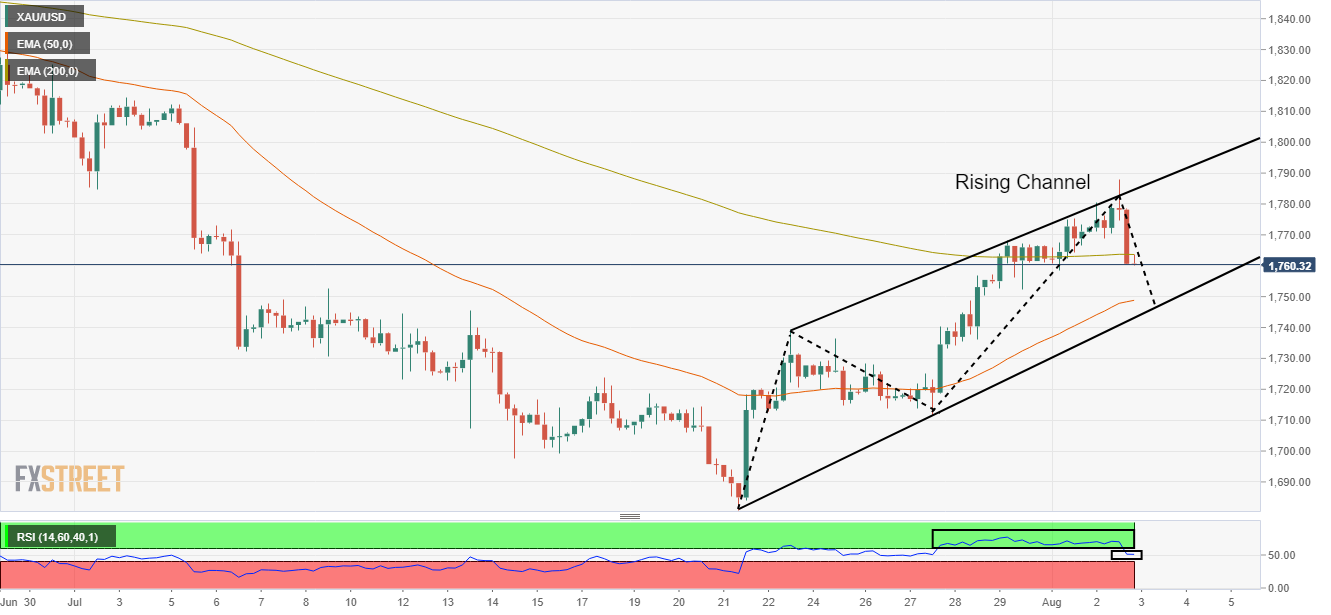
Gold technical analysis
A rising channel formation by the gold prices on a four-hour scale advocates the continuation of an upside move on a broader bias. The upper portion of the above-mentioned chart pattern is placed from July 22 high at $1,739.37 while the lower portion is plotted from July 21 low at $1,681.87. The corrective wave in the chart pattern is likely to drag the gold prices below the 200-period Exponential Moving Average (EMA) at $1,748.57.
The precious metal has slipped below the crucial 50-EMA at $1,764.24, which signals more weakness ahead.
Also, the Relative Strength Index (RSI) (14) has slipped into the 40.00-60.00 range, which indicates that gold prices are not carrying bullish momentum for a while.
Gold four-hour chart


© 2000-2026. All rights reserved.
This site is managed by Teletrade D.J. LLC 2351 LLC 2022 (Euro House, Richmond Hill Road, Kingstown, VC0100, St. Vincent and the Grenadines).
The information on this website is for informational purposes only and does not constitute any investment advice.
The company does not serve or provide services to customers who are residents of the US, Canada, Iran, The Democratic People's Republic of Korea, Yemen and FATF blacklisted countries.
Making transactions on financial markets with marginal financial instruments opens up wide possibilities and allows investors who are willing to take risks to earn high profits, carrying a potentially high risk of losses at the same time. Therefore you should responsibly approach the issue of choosing the appropriate investment strategy, taking the available resources into account, before starting trading.
Use of the information: full or partial use of materials from this website must always be referenced to TeleTrade as the source of information. Use of the materials on the Internet must be accompanied by a hyperlink to teletrade.org. Automatic import of materials and information from this website is prohibited.
Please contact our PR department if you have any questions or need assistance at pr@teletrade.global.
transfers