- Analytics
- News and Tools
- Market News
- Gold Price Analysis: XAU/USD sees establishment above $1,770 as DXY surrenders gains
Gold Price Analysis: XAU/USD sees establishment above $1,770 as DXY surrenders gains
- Gold price is displaying a balanced auction profile above $1,770.00 as investors await US CPI.
- A solid growth rate and upbeat US NFP will delight the Fed.
- Lower oil prices are responsible for lower consensus for the US Inflation rate.
Gold price (XAU/USD) has chartered its territory in a narrow range of $1,771.60-1,776.30 as the US dollar index (DXY) is expecting a bumpy ride after facing barricades around 106.80. The precious metal is in a consolidation territory followed by a sheer downside move after the US Bureau of Labor Statistics reported upbeat US Nonfarm Payrolls (NFP).
The US economy has added 528k jobs in the US labor market, significantly higher than the expectations of 250k and the prior release of 372k. This is going to support the Federal Reserve (Fed) in hiking interest rates unhesitatingly. The growth rate in the US economy is rock solid and now surprisingly higher US NFP despite a halt in the recruitment process by the US corporate will delight Fed policymakers to sound hawkish.
Meanwhile, the US dollar index (DXY) has surrendered its entire intraday gains and has slipped below the opening price. Now, investors are awaiting the release of the US Consumer Price Index (CPI). The annual inflation figure is likely to remain lower at 8.7% against the prior release of 9.1%. Oil prices have remained in a negative trajectory in July, which might be the critical factor for a decent slippage in the price rise index.
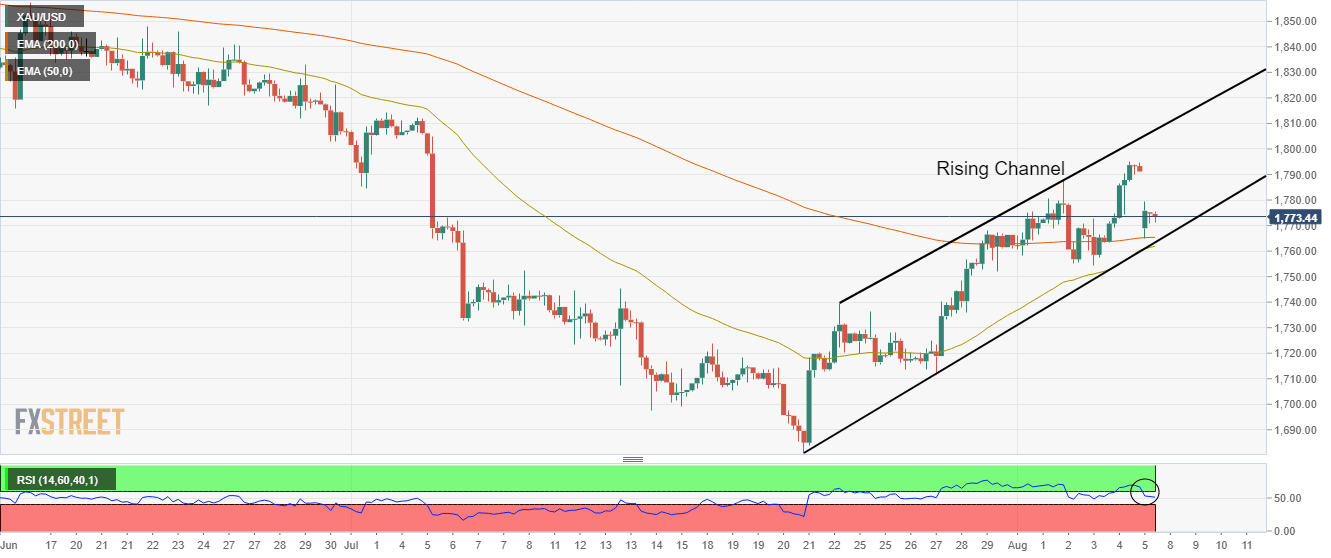
Gold technical analysis
On a four-hour scale, the gold price is declining towards the lower portion of the Rising Channel, which is placed from July 21 low at $1,681.87. While the upper portion is plotted from July 22 high at $1,739.37.
The precious metal has defended the 200-period Exponential Moving Average (EMA) at $1,765.80. Also, the bright metal is holding above the 50-EMA at $1,760.00, which signals the strength of the gold prices.
While, the Relative Strength Index (RSI) (14) has shifted into the 40.00-60.00 range, which indicates that the gold bulls are not holding a bullish momentum for a while.
Gold four-hour chart


© 2000-2026. All rights reserved.
This site is managed by Teletrade D.J. LLC 2351 LLC 2022 (Euro House, Richmond Hill Road, Kingstown, VC0100, St. Vincent and the Grenadines).
The information on this website is for informational purposes only and does not constitute any investment advice.
The company does not serve or provide services to customers who are residents of the US, Canada, Iran, The Democratic People's Republic of Korea, Yemen and FATF blacklisted countries.
Making transactions on financial markets with marginal financial instruments opens up wide possibilities and allows investors who are willing to take risks to earn high profits, carrying a potentially high risk of losses at the same time. Therefore you should responsibly approach the issue of choosing the appropriate investment strategy, taking the available resources into account, before starting trading.
Use of the information: full or partial use of materials from this website must always be referenced to TeleTrade as the source of information. Use of the materials on the Internet must be accompanied by a hyperlink to teletrade.org. Automatic import of materials and information from this website is prohibited.
Please contact our PR department if you have any questions or need assistance at pr@teletrade.global.
transfers