- Analytics
- News and Tools
- Market News
- Gold Price Forecast: XAU/USD bears seeking a critical rally in US yields around CPI
Gold Price Forecast: XAU/USD bears seeking a critical rally in US yields around CPI
- Gold is consolidated ahead of the US CPI data.
- 10-year US yields are in focus below a key trendline resistance.
The gold price is flat in Tokyo as markets await the US inflation data for July that will come out during the New York open. The price has been supported by lower yields and that is supportive because the yellow metal offers no interest. The US 10-year note made a fresh corrective low of 2.746% on Tuesday but they have since recovered to a high of 2.816% but still far below their 52-week range high of 3.497% printed in mid-June 2022.
US CPI in focus
Markets are fixated on the US inflation data coming on Wednesday where prices likely rose by a level that will prompt further interest rate hikes from the Federal Reserve.
Combined with last week's NFP report, the Fed is expected to hike interest rates by another 75 basis points at the next Fed meeting in September, although there will be another report before the next Federal Reserve meeting. Nevertheless, officials to pay close attention to core inflation this time around. ''A continuation of recent trends would be unwelcomed and likely tilt the Fed toward another substantive rate increase at the 20‑21 September FOMC meeting,'' analysts at ANZ Bank said:
-637956636349656826.png)
Historical data chart
''The market needs to decide whether the slowing headline is more important than the sticky and strong core,'' analysts at TD Securities said. ''The USD remains sensitive to US data surprises. ''We will be short-term focused on whether this number shakes resilient risk sentiment, as that will also help inform near-term USD price action.''
As far as predictions go for the Fed, WIRP is now showing over 75% odds of a 75 bp hike at the September 20-21 FOMC meeting which would be expected to keep the greenback in the hands of the bulls. However, markets are still pricing in a quick turnaround by the Fed into an easing cycle in H1 2023, as analysts at Brown Brothers Harriman explained. ''It's pretty clear that the Fed doesn't see it that way and the data bear that out, at least for now.''
Besides the inflation data, ahead of the September 20-21 FOMC meeting, the Jackson Hole Economic Symposium scheduled for August 25-27 will be keenly eyed. Fed Chairs often use this symposium in August to announce or hint at policy shifts ahead of the September FOMC meetings and the analysts at BBH explained that ''by late August, we will have seen all the major July data and some of the early August surveys such as the preliminary S&P Global PMI readings and regional Fed surveys. The Fed will also have a good idea of how the economy is doing in Q3. That said, we do not think the Fed will make any major policy announcements or paint itself into a corner ahead of next month’s FOMC meeting.''
Consequently, for gold, the CPI data and Jackson Hole will be important. For today's inflation data, a higher-than-expected reading could be the catalyst for a final shake-out of stubborn and stale shorts within the volatility ahead of the next significant move to the downside. On the other hand, if the US dollar were to sell off on a lower reading, then a deeper bullish correcting in gold prices would be expected.
Gold technical analysis
The weekly gold chart and the daily 10-year yields can help to determine the overall directional bias for gold.
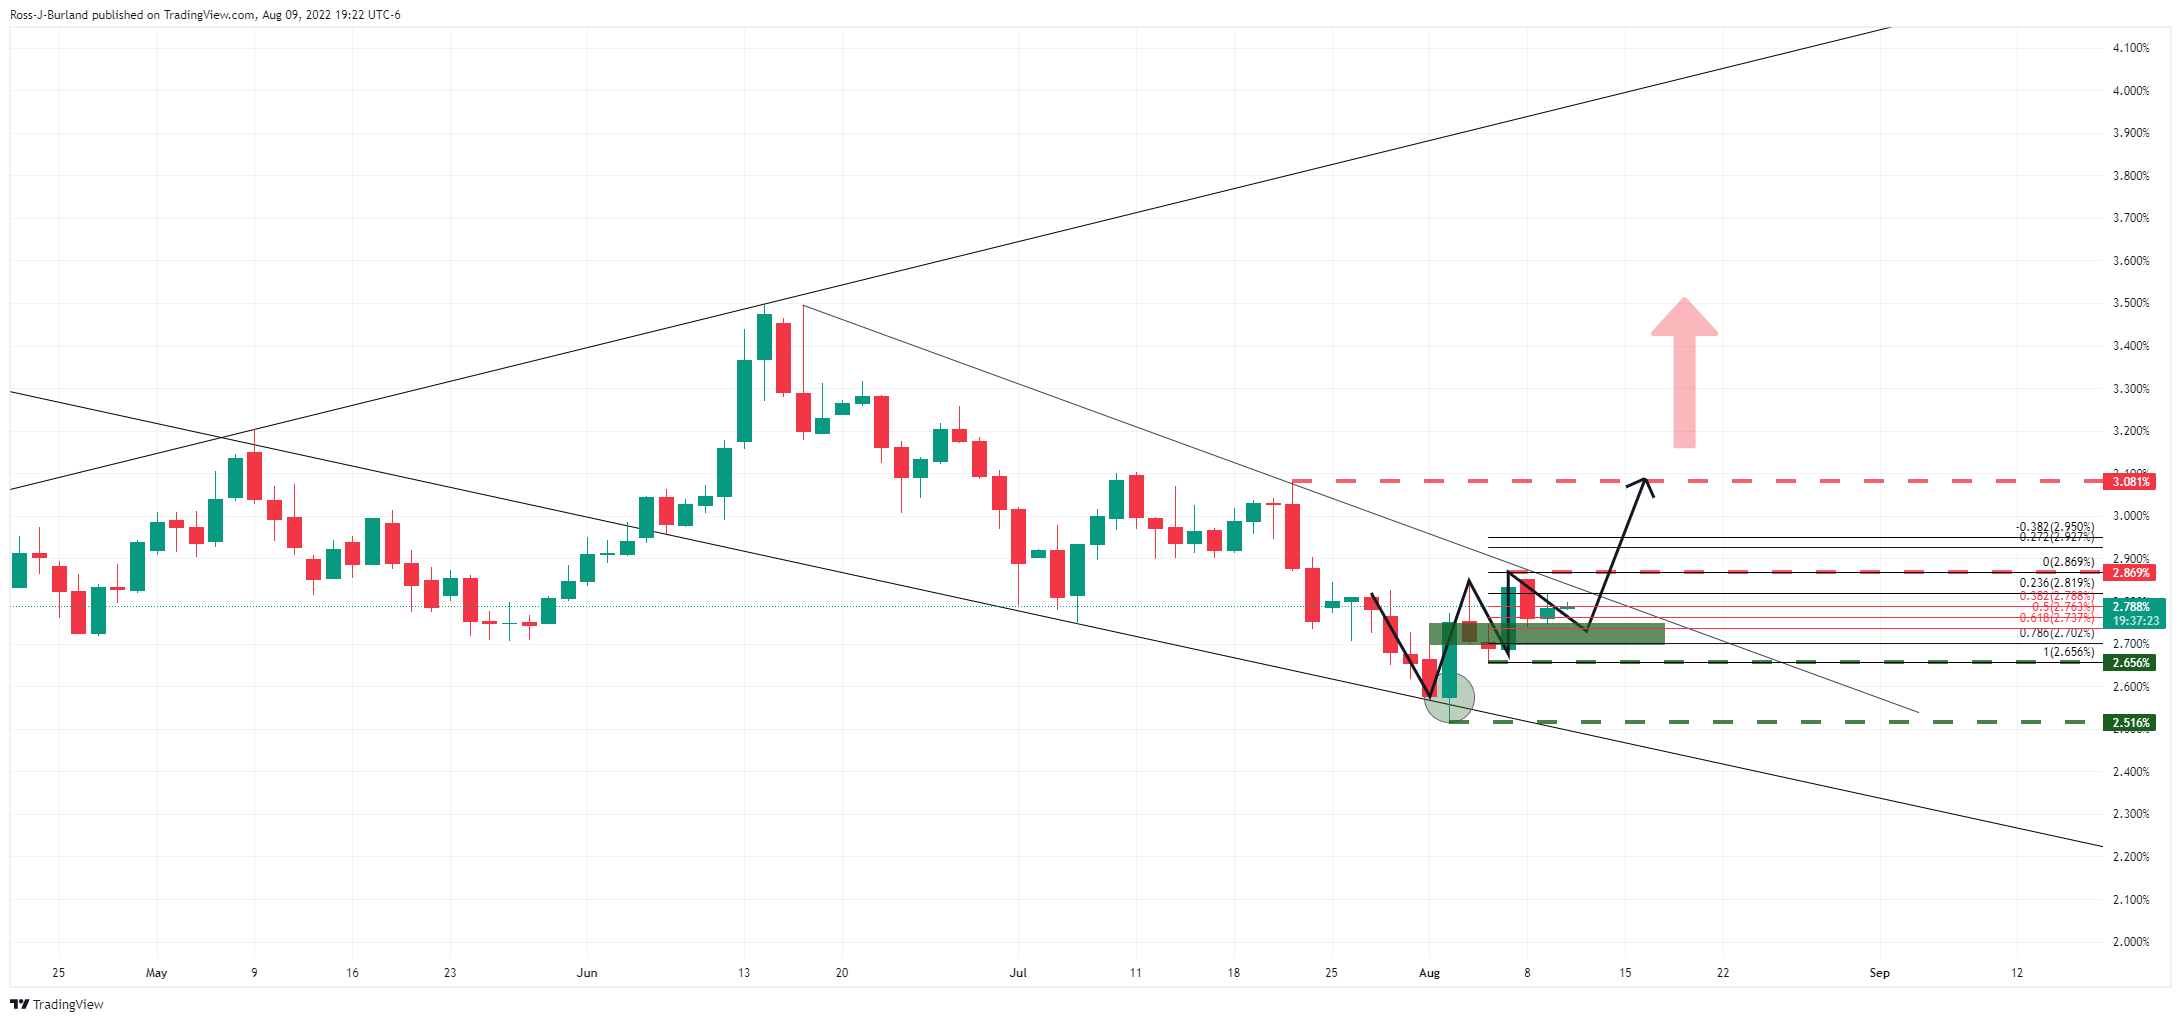
The 10-year yield has dropped towards the neckline of the W-formation on the daily chart within the lower boundary of the broadening formation.
If the price holds above the flagged levels on the chart above, then a break of the trendline resistance could result in a rally in yields, a weight for gold prices. Conversely, should the weekly chart's correction is yet to reach a 61.8% golden ratio as follows:
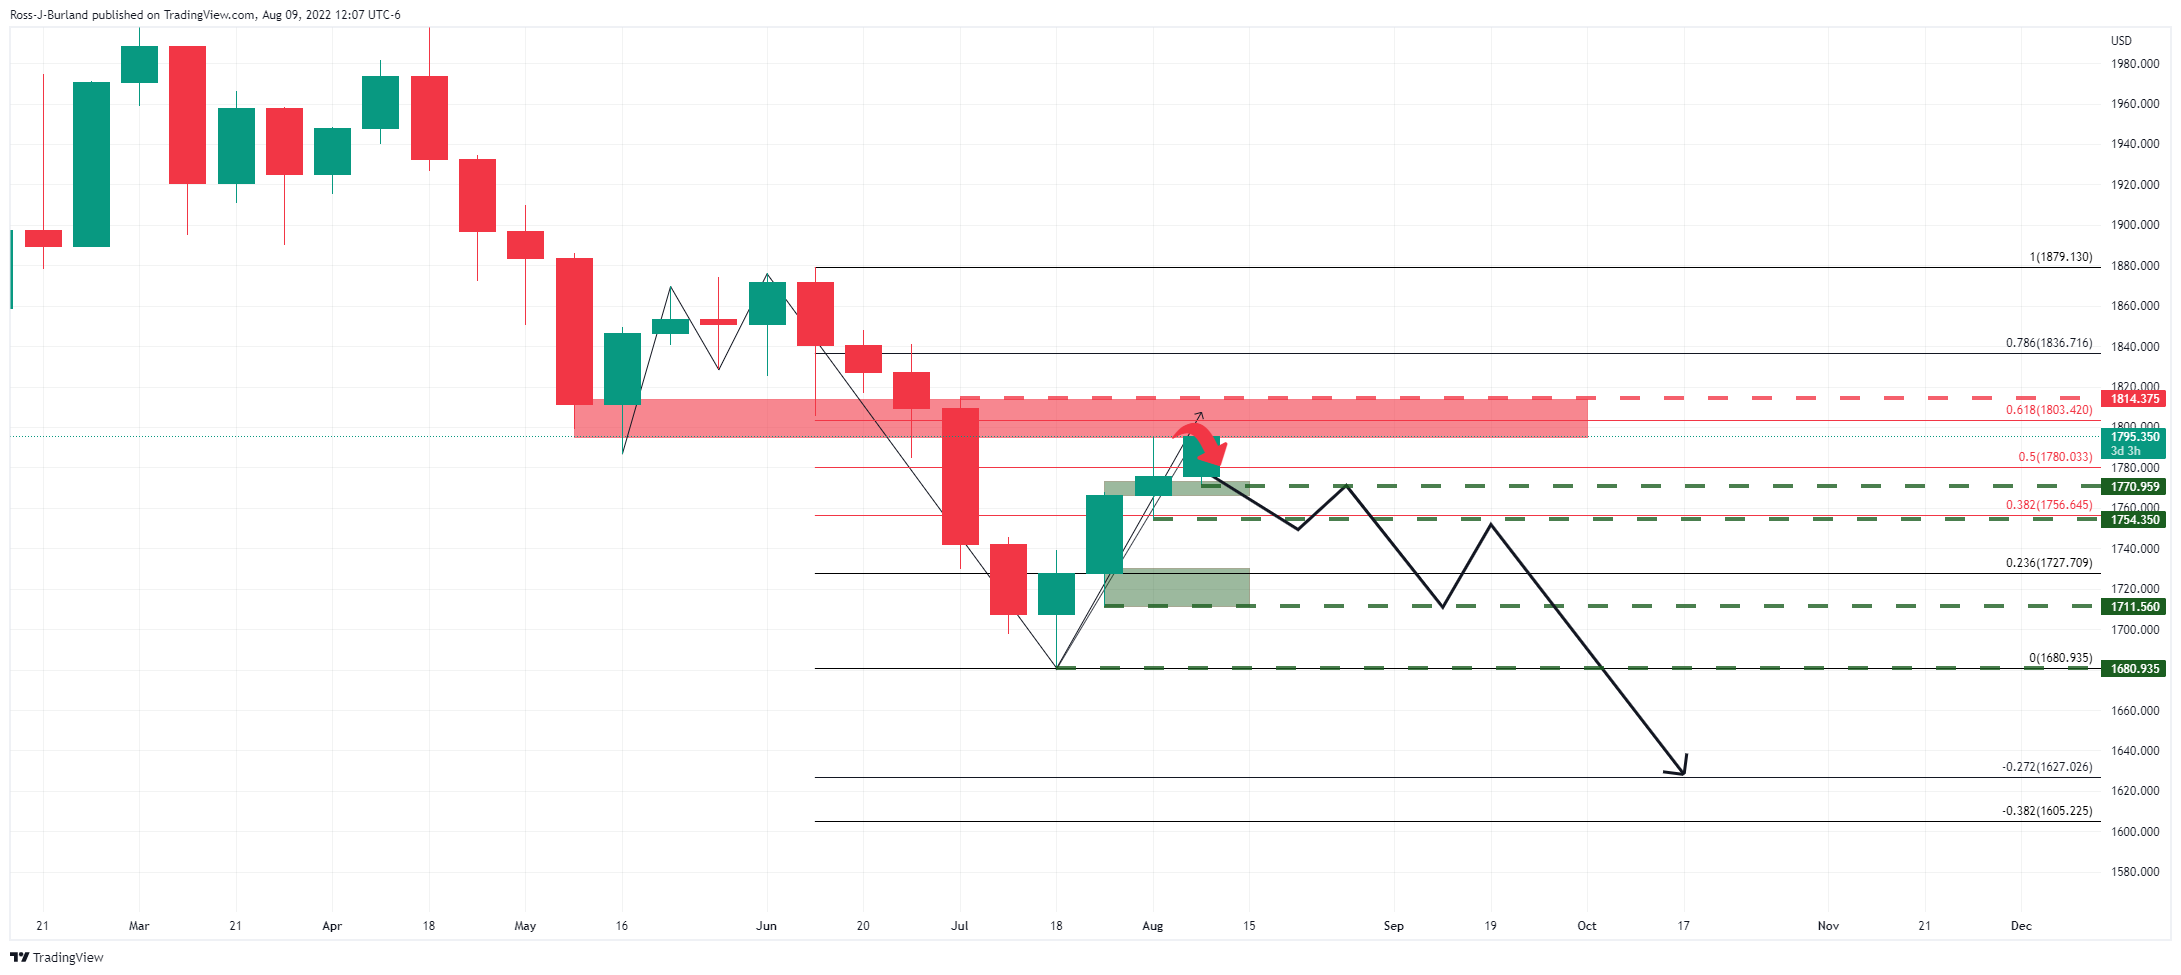
The data could determine the price trajectory for the day ahead and the rest of the week and should it reconfirm the sentiment in the market, then gold would be expected to come under pressure as illustrated in the weekly chart above. However, a break of $1,815 would be significant and will open risk to the 78.6% Fibonacci near $1,836 which has a confluence with the neckline resistance of the M-formation's neckline.


© 2000-2026. All rights reserved.
This site is managed by Teletrade D.J. LLC 2351 LLC 2022 (Euro House, Richmond Hill Road, Kingstown, VC0100, St. Vincent and the Grenadines).
The information on this website is for informational purposes only and does not constitute any investment advice.
The company does not serve or provide services to customers who are residents of the US, Canada, Iran, The Democratic People's Republic of Korea, Yemen and FATF blacklisted countries.
Making transactions on financial markets with marginal financial instruments opens up wide possibilities and allows investors who are willing to take risks to earn high profits, carrying a potentially high risk of losses at the same time. Therefore you should responsibly approach the issue of choosing the appropriate investment strategy, taking the available resources into account, before starting trading.
Use of the information: full or partial use of materials from this website must always be referenced to TeleTrade as the source of information. Use of the materials on the Internet must be accompanied by a hyperlink to teletrade.org. Automatic import of materials and information from this website is prohibited.
Please contact our PR department if you have any questions or need assistance at pr@teletrade.global.
transfers