- Analytics
- News and Tools
- Market News
- USD/JPY Price Analysis: Buyers react to a bullish-doji in the daily chart
USD/JPY Price Analysis: Buyers react to a bullish-doji in the daily chart
- Based on a softer US inflation report, USD/JPY climbs during the week by 1.14%, after a volatile last three days.
- USD/JPY is neutral biased, but a doji emerging in the daily chart could pave the way for further upside.
- In the near term, the major is sideways, though oscillators point upwards, so it is slightly skewed to the upside.
The USD/JPY slightly climbed on Thursday following the release of the University of Michigan Consumer Sentiment for August, which exceeded estimations, but consumer expectations of inflation remained mixed. Nevertheless, it was not an excuse for investors seeking return, shifting toward riskier assets, to the detriment of safe-haven assets. At the time of writing, the USD/JPY is trading at 133.48 above its opening price by 0.39%.
USD/JPY Price Analysis: Technical outlook
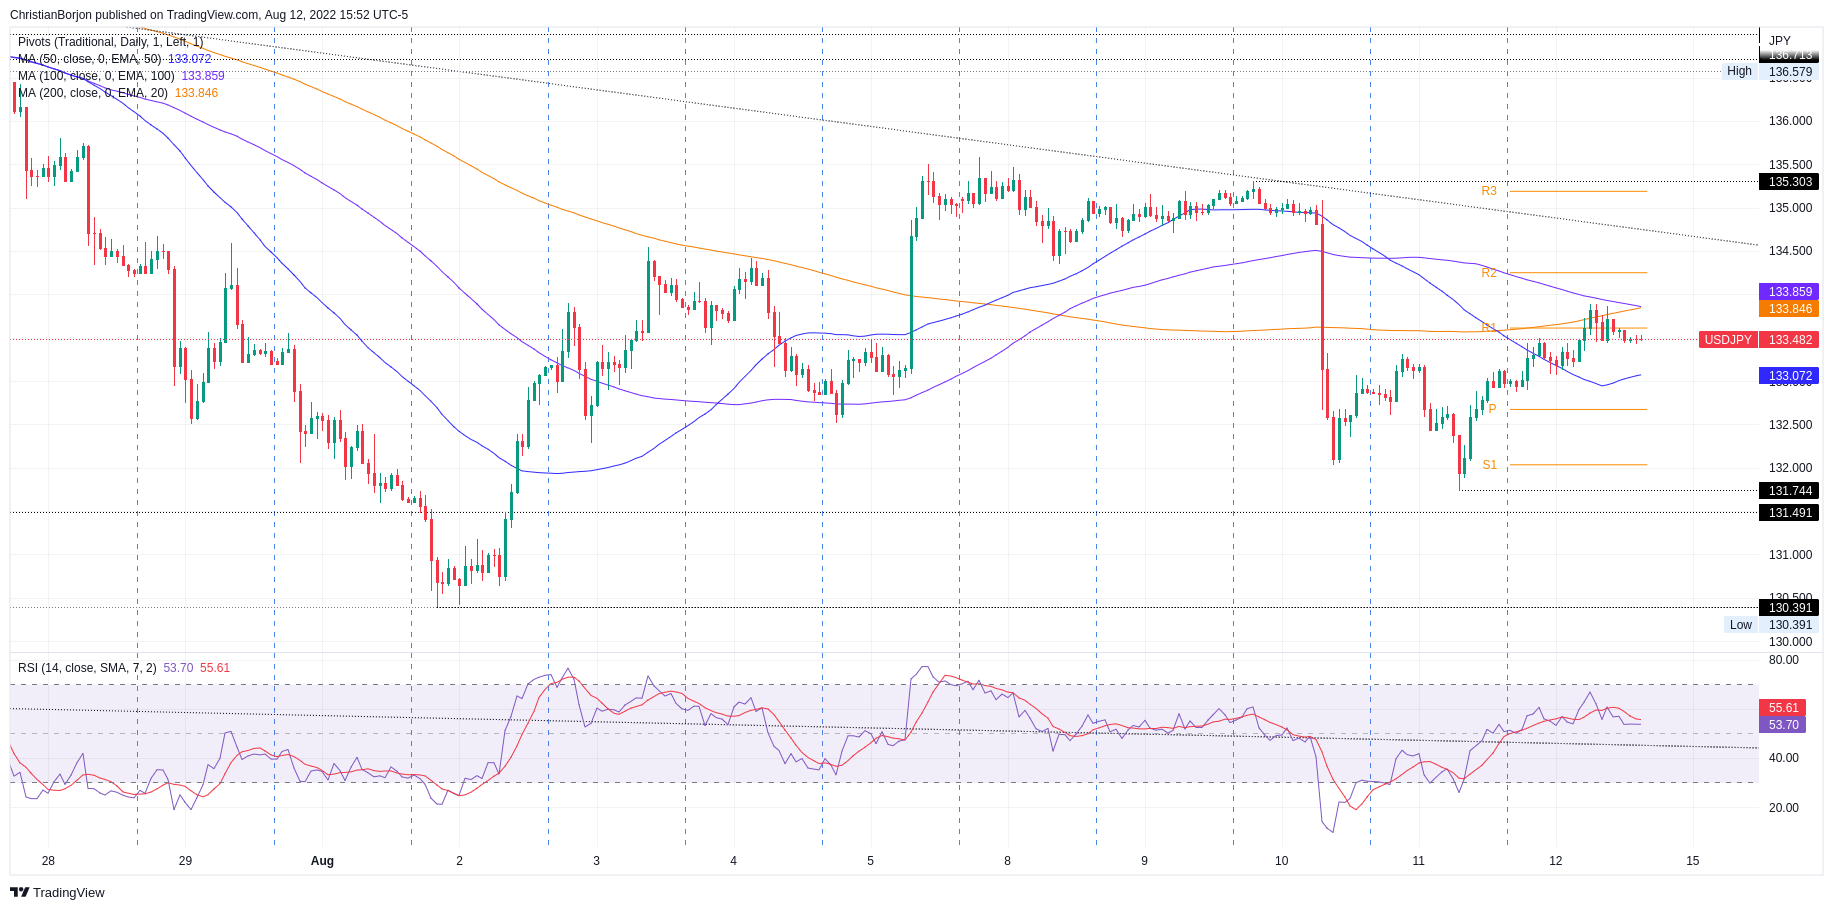
The USD/JPY daily chart portrays Thursday’s price action formed a doji, preceded by a downtrend, indicating that the downtrend is losing steam. Worth noticing the Relative Strength Index accelerated its uptrend to the 50-midline, showing that buying pressure is picking up. Nevertheless, the major remains sideways unless buyers reclaim the 50-day EMA at 135.29.
In the near term, the USD/JPY hourly chart the pair as neutral. However, price action since late Wednesday shows that the pair has begun trading upwards, but at a steady pace, as shown by the Relative Strenght Index (RSI), which could mean some things: USD/JPY shorts booking profits, after a stellar run of 700 pips downwards, and buyers slowly beginning to add to their longs, in speculation of higher US 10-year bond yield rates.
Therefore, the USD/JPY is sideways. Upwards, the major’s first resistance would be the confluence of the 100 and 200-hour EMAs at 133.84-85, followed by the 135.00 figure, followed by the August 10 high at 135.30.
On the flip side, the USD/JPY first support would e the 50-hour EMA at 133.07. The break below exposes crucial demand zones, the August 11 pivot low at 131.73, followed by the August 2 low at 130.39.
 USD/JPY Hourly chart
USD/JPY Key Technical Levels


© 2000-2026. All rights reserved.
This site is managed by Teletrade D.J. LLC 2351 LLC 2022 (Euro House, Richmond Hill Road, Kingstown, VC0100, St. Vincent and the Grenadines).
The information on this website is for informational purposes only and does not constitute any investment advice.
The company does not serve or provide services to customers who are residents of the US, Canada, Iran, The Democratic People's Republic of Korea, Yemen and FATF blacklisted countries.
Making transactions on financial markets with marginal financial instruments opens up wide possibilities and allows investors who are willing to take risks to earn high profits, carrying a potentially high risk of losses at the same time. Therefore you should responsibly approach the issue of choosing the appropriate investment strategy, taking the available resources into account, before starting trading.
Use of the information: full or partial use of materials from this website must always be referenced to TeleTrade as the source of information. Use of the materials on the Internet must be accompanied by a hyperlink to teletrade.org. Automatic import of materials and information from this website is prohibited.
Please contact our PR department if you have any questions or need assistance at pr@teletrade.global.
transfers