- Analytics
- News and Tools
- Market News
- Silver Price Analysis: XAG/USD dives towards the 50-DMA, forming a bearish-engulfing candle pattern
Silver Price Analysis: XAG/USD dives towards the 50-DMA, forming a bearish-engulfing candle pattern
- Silver price is upward biased from a monthly chart perspective.
- In the weekly chart, XAG/USD remains below its 200-week EMA, downward biased.
- XAG/USD daily chart illustrates silver as neutral-to-downwards, though a bearish-engulfing candle pattern suggests a leg-down is on the cards.
Silver price edges lower during Monday’s North American session, down by 2.40% courtesy of US dollar strength, despite falling US Treasury bond yields, ahead of the release of the last FOMC monetary policy minutes. At the time of writing, the XAG/USD formed a bearish-engulfing candle pattern, trading at $20.23.
Silver Price Analysis (XAG/USD): Technical outlook
The white metal outlook looks more positive than negative from a monthly chart perspective. July’s price action formed a dragonfly-doji in a crowded area with the 50, 100, and 200-monthly MAs lying around the $18.48-$20.17 region, which could pave the way for further gains. On the topside, the 20-month EMA at $23.81 might cap further XAG/USD gains.
 XAG/USD Monthly chart
In the meantime, the XAG/USD weekly chart portrays the non-yielding metal struggling at the 200-week MA, at $20.60. Nevertheless, unless sellers push silver below $19.80, buyers could remain hopeful of higher prices, though they would face a wall of resistance at around $21.48, the 20-week EMA. Once cleared, it would pave the way towards the 50-week EMA at $22.73, ahead of the 100-week at $24.11.
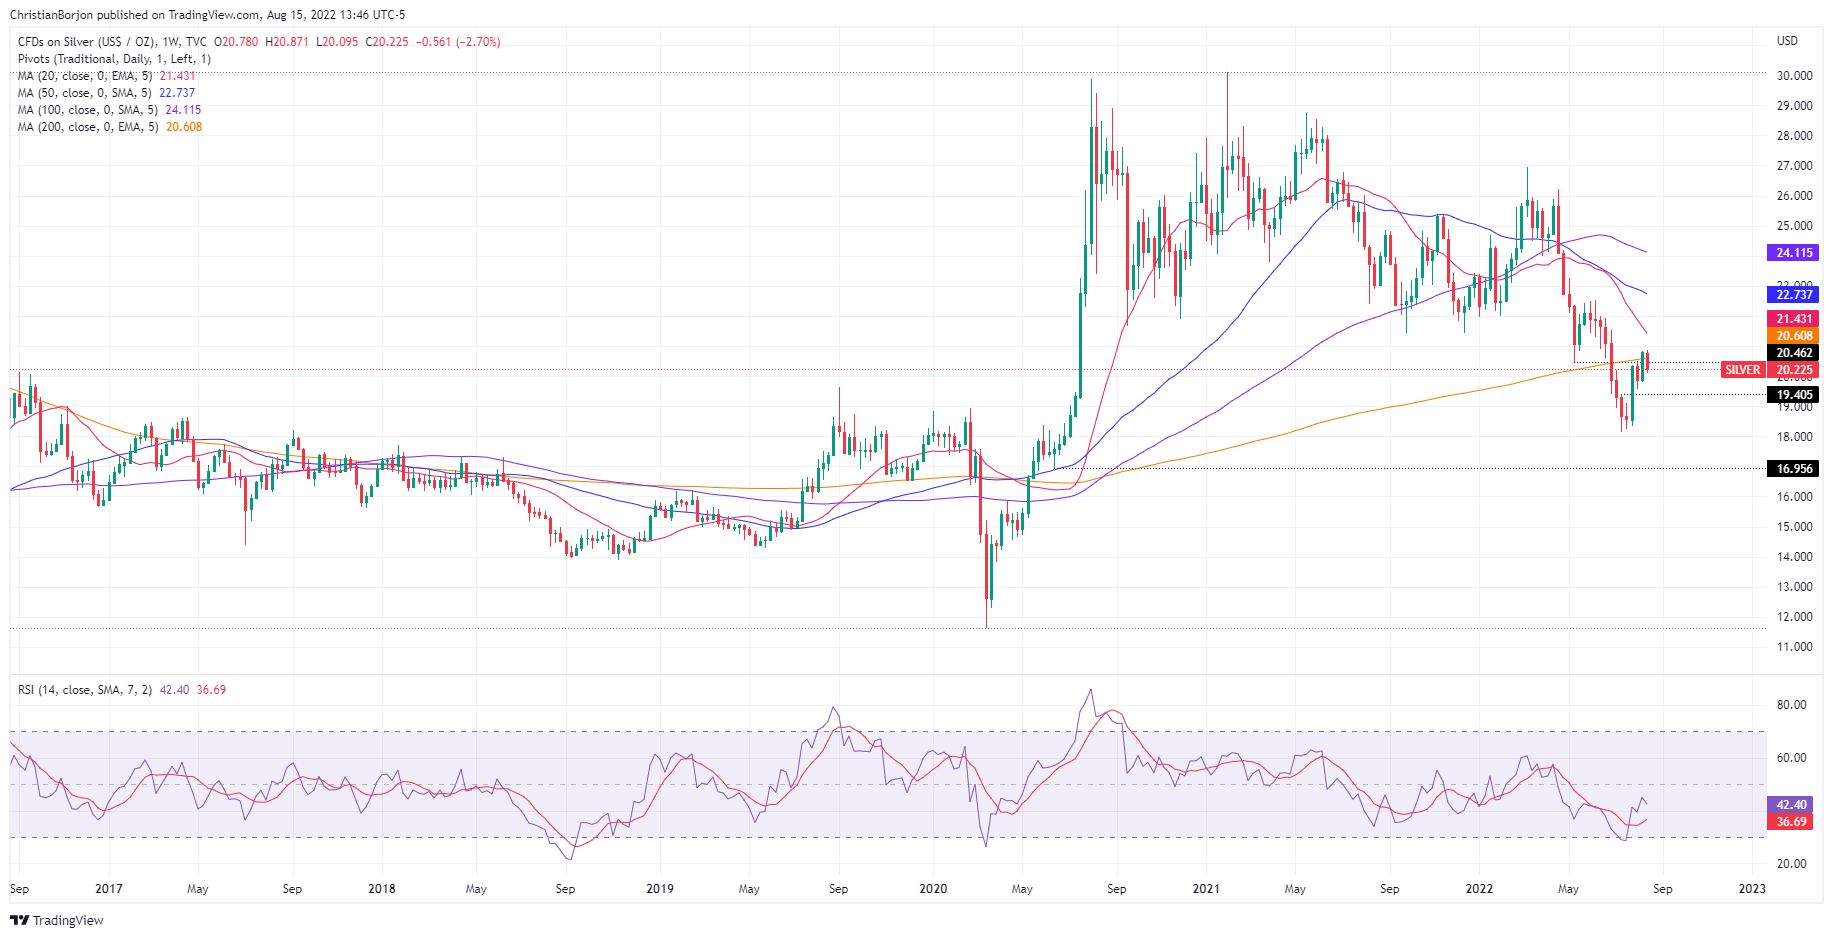 XAG/USD Weekly chart
The XAG/USD daily chart portrays silver as neutral-to-downwards biased. As previously mentioned, a bearish-engulfing candle pattern surfaced. Still, the 50-day EMA at $20.18 is a difficult support level to overcome for sellers, but the Relative Strength Index (RSI) aiming lower, towards the 50-midline, might open the door for further losses.
If XAG/USD sellers achieve a daily close below the above-mentioned, the XAG/USD next support would be the $20.00 figure, which, once cleared, could test the 20-day EMA at $19.73. On the flip side, if XAG/USD buyers hold the fort above the former, then the XAG/USD first resistance would be the $21.00 figure. Break below will expose crucial resistance levels, like the 50-day EMA at $21.68, followed by the 200-day EMA at $22.68.
 XAG/USD Daily chart
Silver (XAG/USD) Key Technical Levels


© 2000-2026. All rights reserved.
This site is managed by Teletrade D.J. LLC 2351 LLC 2022 (Euro House, Richmond Hill Road, Kingstown, VC0100, St. Vincent and the Grenadines).
The information on this website is for informational purposes only and does not constitute any investment advice.
The company does not serve or provide services to customers who are residents of the US, Canada, Iran, The Democratic People's Republic of Korea, Yemen and FATF blacklisted countries.
Making transactions on financial markets with marginal financial instruments opens up wide possibilities and allows investors who are willing to take risks to earn high profits, carrying a potentially high risk of losses at the same time. Therefore you should responsibly approach the issue of choosing the appropriate investment strategy, taking the available resources into account, before starting trading.
Use of the information: full or partial use of materials from this website must always be referenced to TeleTrade as the source of information. Use of the materials on the Internet must be accompanied by a hyperlink to teletrade.org. Automatic import of materials and information from this website is prohibited.
Please contact our PR department if you have any questions or need assistance at pr@teletrade.global.
transfers