- Analytics
- News and Tools
- Market News
- Gold Price Forecast: XAU/USD advances towards $1,760 as Fed looks to halt bigger rate hike culture
Gold Price Forecast: XAU/USD advances towards $1,760 as Fed looks to halt bigger rate hike culture
- Gold price is marching towards $1,760.00 as Fed is set to ditch the 75 bps rate hike regime.
- The US Dollar is prone to decline toward a three-month low at 105.34 amid an upbeat market mood.
- Economists at ANZ Bank consider the Gold rally an exaggerated one as the inflation rate is well above 2% target.
Gold price (XAU/USD) has attempted a recovery after declining to near $1,754.00 in the early Tokyo session. The precious metal remained sideways on Thursday due to less volume as United States markets were closed on account of Thanksgiving Day. Considering the optimism in the overall market, the gold price is expected to continue its upside journey toward the crucial hurdle of $1,760.00.
The USD index (DXY) displayed back-and-forth moves below the round-level resistance of 106.00. The US Dollar is prone to test a three-month low at 105.34 as the Federal Reserve (Fed) is set to ditch the bigger rate hike culture in its December monetary policy meeting. Meanwhile, S&P500 futures added some gains in the holiday session amid an upbeat market mood.
The Federal Open Market Committee (FOMC) minutes have cleared that the majority of Fed policymakers are in favor of decelerating the current interest rate hike pace. This may keep gold prices in a comfort zone. However, ANZ Bank shares a contrary opinion on the same. They believe that softer-than-expected US inflation triggered a sell-off in the US Dollar, helping Gold prices to recover. That is unlikely to last as inflation at 7.7% is well above the central bank’s target of 2%. “It is not enough for the Fed to be confident that inflation is on track to move back to 2% sustainably.
Gold technical analysis
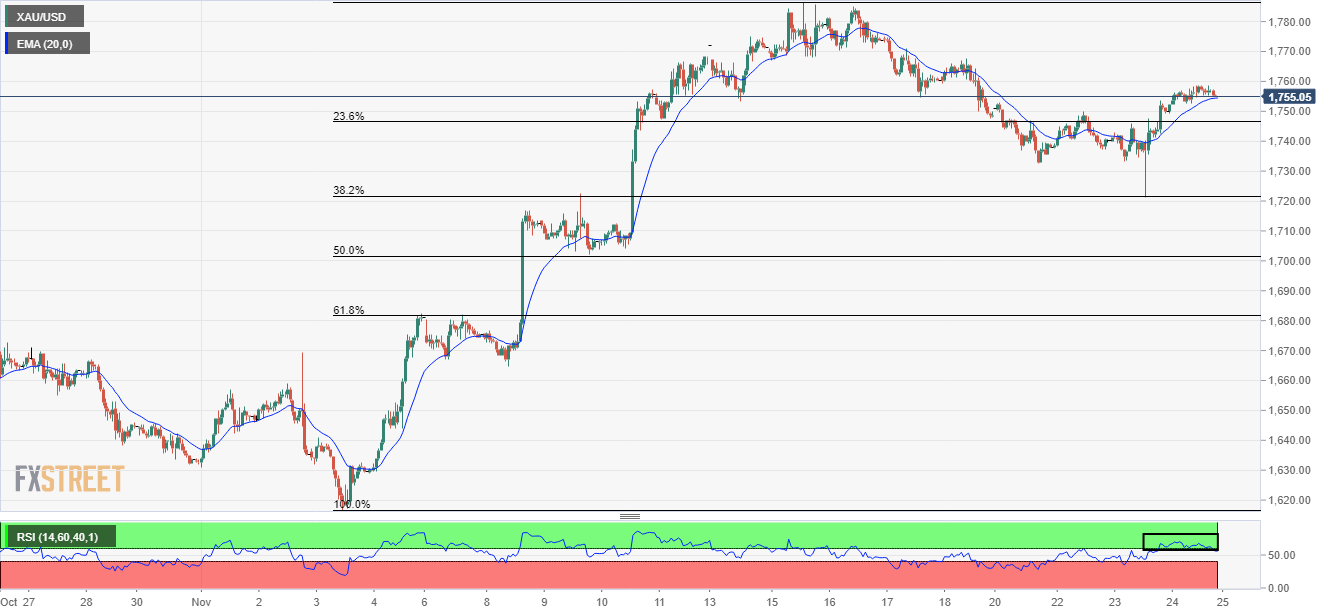
On an hourly scale, Gold price has displayed a steep recovery after testing the 38.2% Fibonacci retracement (plotted from November 3 low at $1,616.69 to November 15 high at $1,758.88) at $1,722.00. The precious metal is looking for support around the 20-period Exponential Moving Average (EMA) at $1,754.65.
Meanwhile, the Relative Strength Index (RSI) (14) is declining into the 40.00-60.00 range, which indicates that Gold price is losing bullish momentum. However, it doesn’t claim a bearish reversal.
Gold hourly chart


© 2000-2026. All rights reserved.
This site is managed by Teletrade D.J. LLC 2351 LLC 2022 (Euro House, Richmond Hill Road, Kingstown, VC0100, St. Vincent and the Grenadines).
The information on this website is for informational purposes only and does not constitute any investment advice.
The company does not serve or provide services to customers who are residents of the US, Canada, Iran, The Democratic People's Republic of Korea, Yemen and FATF blacklisted countries.
Making transactions on financial markets with marginal financial instruments opens up wide possibilities and allows investors who are willing to take risks to earn high profits, carrying a potentially high risk of losses at the same time. Therefore you should responsibly approach the issue of choosing the appropriate investment strategy, taking the available resources into account, before starting trading.
Use of the information: full or partial use of materials from this website must always be referenced to TeleTrade as the source of information. Use of the materials on the Internet must be accompanied by a hyperlink to teletrade.org. Automatic import of materials and information from this website is prohibited.
Please contact our PR department if you have any questions or need assistance at pr@teletrade.global.
transfers