- Analytics
- News and Tools
- Market News
- GBP/USD Price Analysis: Bulls await move beyond 200 DMA/ascending channel confluence hurdle
GBP/USD Price Analysis: Bulls await move beyond 200 DMA/ascending channel confluence hurdle
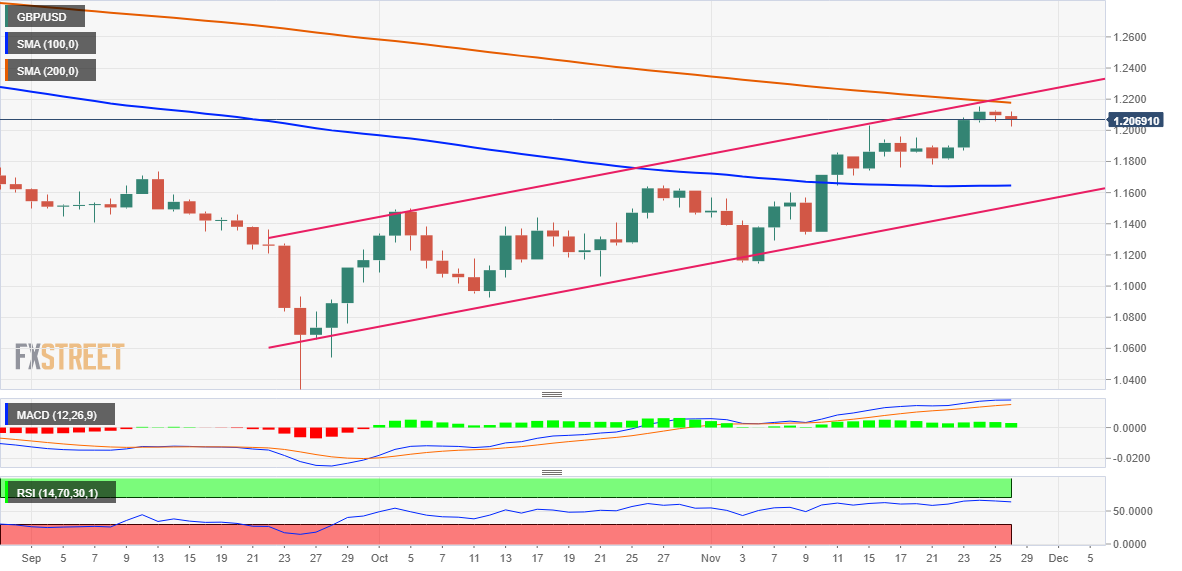
- GBP/USD reverses an intraday dip amid the emergence of heavy selling around the USD.
- Spot prices lack bullish conviction and remain below a technically significant 200-day SMA.
- The said hurdle coincides with ascending channel resistance and should act as a pivot point.
The GBP/USD pair attracts some buying near the 1.2025 region on Monday, albeit struggles to capitalize on the modest intraday uptick. The pair seesaws between tepid gains/minor losses through the early North American session and now seems to have stabilized in neutral territory, around the 1.2060 area.
The US Dollar comes under heavy selling pressure amid rising bets for a relatively smaller Fed rate hike in December and turns out to be a key factor offering support to the GBP/USD pair. That said, the risk-off mood helps limit the downside for the safe-haven buck. Apart from this, a bleak outlook for the UK economy contributes to capping any meaningful gains for the major.
From a technical perspective, spot prices have been trending higher along an upward-sloping channel over the past two months or so. The top boundary of the said channel, currently around the 1.2170-1.2175 zone, coincides with the very important 200-day SMA. This should now act as a pivotal point, which if cleared decisively will be seen as a fresh trigger for bullish traders.
Meanwhile, oscillators on the daily chart are holding in the positive territory and are still far from being in the overbought zone, favouring bullish traders. That said, it will still be prudent to wait for a convincing breakout through the aforementioned confluence hurdle before positioning for any further appreciating move towards the 1.2270-1.2275 resistance zone.
On the flip side, the daily swing low, around the 1.2025 area, could protect the immediate downside ahead of the 1.2000 psychological mark. Any further decline is more likely to attract fresh buyers and remain limited near the 1.1965 horizontal support. Failure to defend the said support levels will make the GBP/USD pair vulnerable to weakening further below the 1.1900 mark.
The corrective decline could drag spot prices towards the next relevant support near the 1.1845-1.1840 region en route to the 1.1800 mark. Some follow-through selling will expose the 1.1730 intermediate support, the 1.1700 round figure and the 100-day SMA, currently around the 1.1650-1.1640 area.
GBP/USD daily chart
Key levels to watch


© 2000-2026. All rights reserved.
This site is managed by Teletrade D.J. LLC 2351 LLC 2022 (Euro House, Richmond Hill Road, Kingstown, VC0100, St. Vincent and the Grenadines).
The information on this website is for informational purposes only and does not constitute any investment advice.
The company does not serve or provide services to customers who are residents of the US, Canada, Iran, The Democratic People's Republic of Korea, Yemen and FATF blacklisted countries.
Making transactions on financial markets with marginal financial instruments opens up wide possibilities and allows investors who are willing to take risks to earn high profits, carrying a potentially high risk of losses at the same time. Therefore you should responsibly approach the issue of choosing the appropriate investment strategy, taking the available resources into account, before starting trading.
Use of the information: full or partial use of materials from this website must always be referenced to TeleTrade as the source of information. Use of the materials on the Internet must be accompanied by a hyperlink to teletrade.org. Automatic import of materials and information from this website is prohibited.
Please contact our PR department if you have any questions or need assistance at pr@teletrade.global.
transfers