- Analytics
- News and Tools
- Market News
- GBP/USD Price Analysis: Refreshes weekly high, eyes 200-day SMA near mid-1.2100s
GBP/USD Price Analysis: Refreshes weekly high, eyes 200-day SMA near mid-1.2100s
- GBP/USD climbs to a fresh weekly high on Thursday amid sustained USD selling bias.
- Dovish remarks by Fed Chair Powell, weaker US bond yields weigh on the greenback.
- The technical set-up favours bullish traders and supports prospects for further gains.
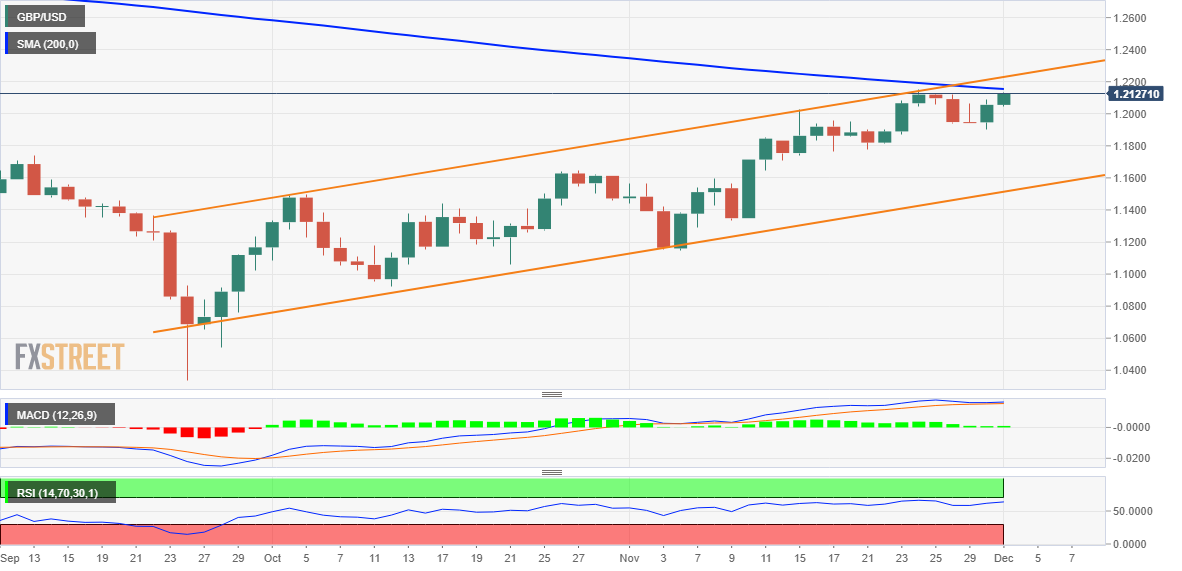
The GBP/USD pair builds on the previous day's goodish rebound from a one-week low and gains traction for the second successive day on Thursday. The pair maintains its bid tone through the first half of the European session and hits a fresh weekly high, around the 1.2130-1.2135 area in the last hour.
The overnight dovish-sounding remarks by Fed Chair Jerome Powell, along with a further decline in the US Treasury bond yields, keep the US Dollar bulls on the defensive near a multi-month low. Apart from this, a generally positive tone around the equity markets is seen undermining the safe-haven buck and acting as a tailwind for the GBP/USD pair.
From a technical perspective, spot prices have now moved well within the striking distance of the very important 200-day SMA. The said barrier is currently pegged near the 1.2150 area, which if cleared will be seen as a fresh trigger for bullish traders and set the stage for an extension of the near-term appreciating move for the GBP/USD pair.
Given that oscillators on the daily chart are holding in the bullish territory and are still far from being in the overbought zone, the GBP/USD pair might then aim to reclaim the 1.2200 mark. The momentum could further get extended and lift spot prices to the top boundary of over a two-month-old ascending channel, currently around the 1.2300 round figure.
On the flip side, any meaningful pullback below the 1.2100 mark now seems to find decent support near the daily low, around the 1.2045 region. A convincing break below might prompt some technical selling and drag the GBP/USD pair back toward the 1.2000 psychological mark. Some follow-through selling will expose the 1.1945-1.1940 horizontal support.
The latter should act as a strong base for spot prices, which if broken decisively will negate any near-term positive bias and pave the way for a deeper corrective decline. The GBP/USD pair might then turn vulnerable to weaken further below the 1.1900 mark and test the next relevant support near the 1.1860-1.1855 horizontal zone.
GBP/USD daily chart
Key levels to watch


© 2000-2026. All rights reserved.
This site is managed by Teletrade D.J. LLC 2351 LLC 2022 (Euro House, Richmond Hill Road, Kingstown, VC0100, St. Vincent and the Grenadines).
The information on this website is for informational purposes only and does not constitute any investment advice.
The company does not serve or provide services to customers who are residents of the US, Canada, Iran, The Democratic People's Republic of Korea, Yemen and FATF blacklisted countries.
Making transactions on financial markets with marginal financial instruments opens up wide possibilities and allows investors who are willing to take risks to earn high profits, carrying a potentially high risk of losses at the same time. Therefore you should responsibly approach the issue of choosing the appropriate investment strategy, taking the available resources into account, before starting trading.
Use of the information: full or partial use of materials from this website must always be referenced to TeleTrade as the source of information. Use of the materials on the Internet must be accompanied by a hyperlink to teletrade.org. Automatic import of materials and information from this website is prohibited.
Please contact our PR department if you have any questions or need assistance at pr@teletrade.global.
transfers