- Analytics
- News and Tools
- Market News
- USD/JPY Price Analysis: Hangs near multi-month low, below 200-day SMA ahead of NFP
USD/JPY Price Analysis: Hangs near multi-month low, below 200-day SMA ahead of NFP
- USD/JPY plummets to a fresh multi-month low on Friday amid sustained USD selling bias.
- A break and acceptance below the 200-day SMA support prospects for additional losses.
- The bearish pressure, however, abates amid oversold conditions and ahead of the NFP.
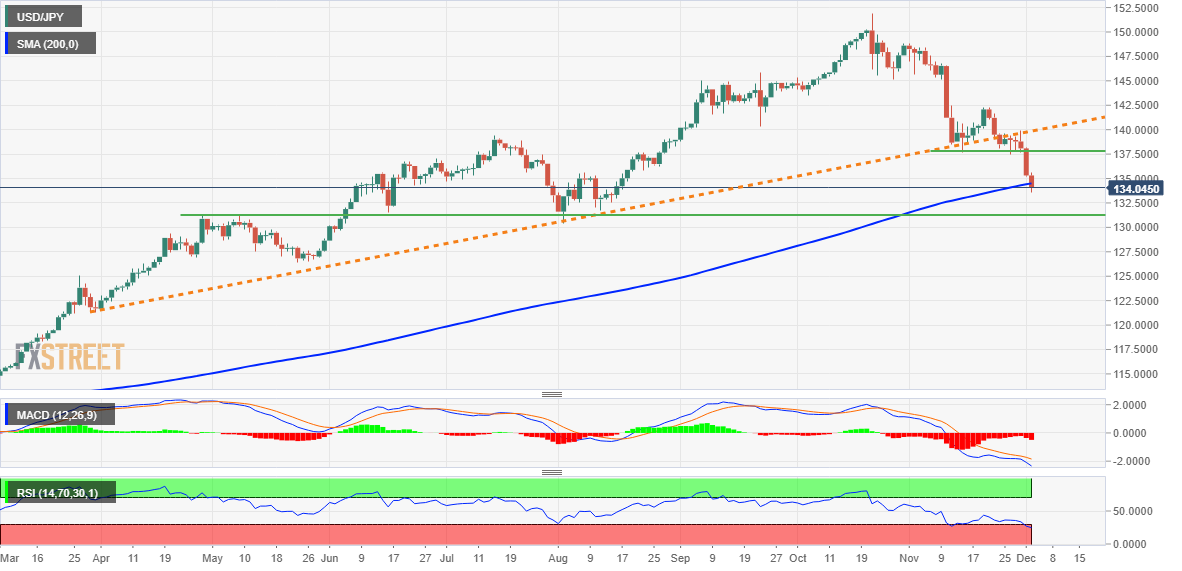
The USD/JPY pair prolongs its bearish trend for the fifth straight day on Friday - also marking the ninth day of a negative move in the previous ten and dives to its lowest level since August 16. The pair now seems to have entered a bearish consolidation phase and is seen hovering around the 134.00 mark as traders await the US NFP report for a fresh impetus.
The relentless US Dollar selling remains unabated amid growing acceptance that the Fed will slow the pace of its rate-hiking cycle. Apart from this, the recent sharp decline in the US Treasury bond yields narrows the US-Japan rate differential, which benefits the Japanese Yen. This, along with the overnight hawkish signals by the Bank of Japan board member Asahi Noguchi contributes to the heavily offered tone surrounding the USD/JPY pair.
From a technical perspective, this week's downfall took confirmed a breakdown through an upward sloping trend-line extending from late March. A subsequent slide below the 137.65-137.50 horizontal support and the 135.00 psychological mark zone is seen as a fresh trigger for bearish traders. Moreover, acceptance below the very important 200-day SMA supports prospects for an extension of the recent depreciating move for the USD/JPY pair.
That said, oscillators on short-term charts are already flashing oversold conditions and warrant some caution. Nevertheless, the USD/JPY pair seems poised to weaken further towards testing sub-133.00 levels. The downward trajectory could eventually drag spot prices below the 132.00 round figure, towards the next relevant support near the 131.50 area en route to the 131.00 mark and the August swing low, around the 130.40-130.35 zone.
On the flip side, the 200-day SMA, currently around the 134.50 region, could act as an immediate strong resistance ahead of the 135.00 mark. A sustained move beyond might trigger a short-covering rally and allow the USD/JPY pair to reclaim the 136.00 round figure. Any subsequent move up, however, is more likely to attract fresh sellers and remain capped near the 136.70 support breakpoint, which should act now act as a pivotal point.
USD/JPY daily chart
Key levels to watch


© 2000-2026. All rights reserved.
This site is managed by Teletrade D.J. LLC 2351 LLC 2022 (Euro House, Richmond Hill Road, Kingstown, VC0100, St. Vincent and the Grenadines).
The information on this website is for informational purposes only and does not constitute any investment advice.
The company does not serve or provide services to customers who are residents of the US, Canada, Iran, The Democratic People's Republic of Korea, Yemen and FATF blacklisted countries.
Making transactions on financial markets with marginal financial instruments opens up wide possibilities and allows investors who are willing to take risks to earn high profits, carrying a potentially high risk of losses at the same time. Therefore you should responsibly approach the issue of choosing the appropriate investment strategy, taking the available resources into account, before starting trading.
Use of the information: full or partial use of materials from this website must always be referenced to TeleTrade as the source of information. Use of the materials on the Internet must be accompanied by a hyperlink to teletrade.org. Automatic import of materials and information from this website is prohibited.
Please contact our PR department if you have any questions or need assistance at pr@teletrade.global.
transfers