- Analytics
- News and Tools
- Market News
- Gold Price Forecast: XAU/USD continues its subdued performance around $1,850, US NFP in focus
Gold Price Forecast: XAU/USD continues its subdued performance around $1,850, US NFP in focus
- Gold price is displaying a sideways profile on a broader note ahead of US Employment data.
- As per FOMC minutes, no Fed policymaker has advocated for cutting rates in CY2023.
- A sheer drop in US NFP and a higher Unemployment Rate could trigger recession fears.
Gold price (XAU/USD) has failed to capitalize on a firmer rally to near $1,860.00 and has corrected gradually to near $1,850.00 in the early European session. The precious metal is likely to continue its lackluster performance till the release of the United States Nonfarm Payrolls (NFP) data.
The risk profile is improving again as S&P500 futures have recovered a majority of losses recorded in the Asian session. Contrary to it, the 10-year US Treasury yields have climbed above 3.72%, portraying ambiguity in market sentiment. The US Dollar Index (DXY) is aiming to surpass the immediate resistance of 140.00.
After the release of the Federal Open Market Committee (FOMC) minutes, which has cleared that no Federal Reserve (Fed) policymaker has advocated for cutting interest rates in CY2023, the street is looking for United States employment data. Only a significant drop in the employment addition numbers and an increase in the Unemployment Rate could force the Fed to look for policy stability or easing it to dodge recession fears.
Gold technical analysis
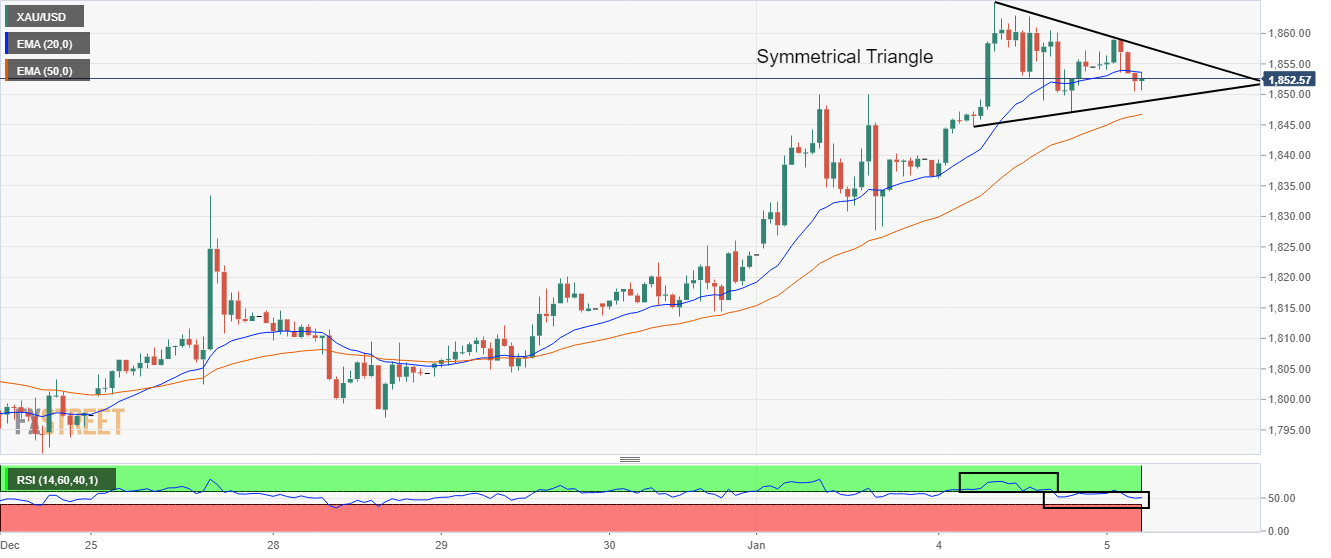
On an hourly scale, Gold price is auctioning in a Symmetrical Triangle chart pattern that signals volatility contraction. It is highly likely that the release of the US Automatic Data Processing (ADP) Employment Change data will result in a volatility breakout.
Overlapping 20-period Exponential Moving Average (EMA) at $1,853.84 with the Gold price indicates rangebound action. Upward-sloping 50-EMA at $1,846.79 indicates that the short-term trend is still bullish.
Meanwhile, the Relative Strength Index (RSI) (14) has shifted into the 40.00-60.00 range from the bullish range of 60.00-80.00, which indicates a loss in the upside momentum.
Gold hourly chart


© 2000-2026. All rights reserved.
This site is managed by Teletrade D.J. LLC 2351 LLC 2022 (Euro House, Richmond Hill Road, Kingstown, VC0100, St. Vincent and the Grenadines).
The information on this website is for informational purposes only and does not constitute any investment advice.
The company does not serve or provide services to customers who are residents of the US, Canada, Iran, The Democratic People's Republic of Korea, Yemen and FATF blacklisted countries.
Making transactions on financial markets with marginal financial instruments opens up wide possibilities and allows investors who are willing to take risks to earn high profits, carrying a potentially high risk of losses at the same time. Therefore you should responsibly approach the issue of choosing the appropriate investment strategy, taking the available resources into account, before starting trading.
Use of the information: full or partial use of materials from this website must always be referenced to TeleTrade as the source of information. Use of the materials on the Internet must be accompanied by a hyperlink to teletrade.org. Automatic import of materials and information from this website is prohibited.
Please contact our PR department if you have any questions or need assistance at pr@teletrade.global.
transfers