- Analytics
- News and Tools
- Market News
- Gold Price Forecast: XAU/USD advances gradually to near $1,920 as risk-on profile recovers
Gold Price Forecast: XAU/USD advances gradually to near $1,920 as risk-on profile recovers
- Gold price is marching towards $1,920.00 as the risk-off impulse is fading away.
- A volatile action is expected from the US Dollar Index as the US markets are opening after a stretched weekend.
- A decline in the PPI figures is going to delight the Fed which is aiming to achieve price stability.
Gold price (XAU/USD) has scaled to near the critical resistance of $1,920.00 in the Asian session. The precious metal picked strength after sensing buying interest around $1,910.00 as the risk-off impulse is losing its grip.
S&P500 futures are aiming to recover their entire losses witnessed on Monday, portraying that investors are shrugging-off any sort of pessimism in an overall bullish market. The 10-year US Treasury yields have eased some gains and have dropped to 3.51%. Going forward, a volatile action is expected from the US Dollar Index (DXY) as the United States markets are opening after a stretched weekend.
Gold price is expected to display a power-pack action after the release of the US Producer Price Index (PPI) data, which will release on Wednesday. Investors should brace for a deceleration in the prices of goods and services at factory gates to match the decline in retail demand. A decline in the PPI figures is going to delight the Federal Reserve (Fed), which is making sheer efforts in achieving price stability in the US economy.
Apart from the US PPI, the release of the monthly Retail Sales data will be of utmost importance. As per the projections, the retail demand (Dec) will escalate by 0.1% vs. -0.6% reported earlier.
Gold technical analysis
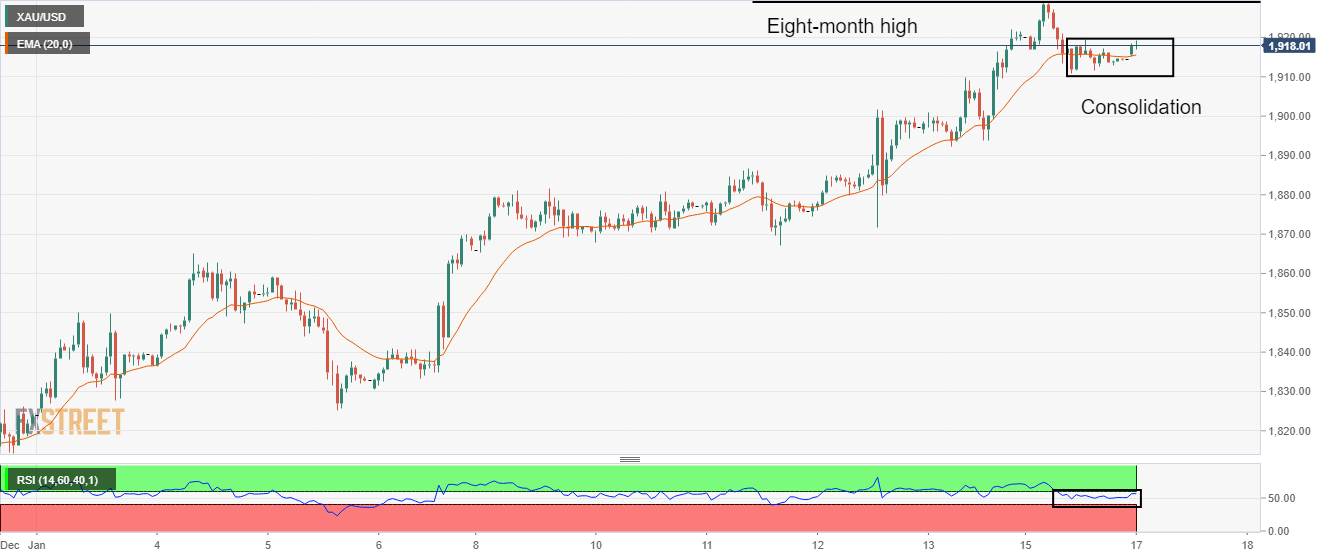
Gold price has corrected after printing a fresh eight-month high at $1,929.00 on an hourly scale. The precious metal has turned sideways in a narrow range of $1,911-1,919 as investors await US PPI data. The 20-period Exponential Moving Average (EMA) at $1,915.54 is overlapping with the asset prices, which indicates a consolidation ahead.
Also, the Relative Strength Index (RSI) (14) is oscillating in a 40.00-60.00 range, which indicates that the asset is rangebound.
Gold hourly chart


© 2000-2026. All rights reserved.
This site is managed by Teletrade D.J. LLC 2351 LLC 2022 (Euro House, Richmond Hill Road, Kingstown, VC0100, St. Vincent and the Grenadines).
The information on this website is for informational purposes only and does not constitute any investment advice.
The company does not serve or provide services to customers who are residents of the US, Canada, Iran, The Democratic People's Republic of Korea, Yemen and FATF blacklisted countries.
Making transactions on financial markets with marginal financial instruments opens up wide possibilities and allows investors who are willing to take risks to earn high profits, carrying a potentially high risk of losses at the same time. Therefore you should responsibly approach the issue of choosing the appropriate investment strategy, taking the available resources into account, before starting trading.
Use of the information: full or partial use of materials from this website must always be referenced to TeleTrade as the source of information. Use of the materials on the Internet must be accompanied by a hyperlink to teletrade.org. Automatic import of materials and information from this website is prohibited.
Please contact our PR department if you have any questions or need assistance at pr@teletrade.global.
transfers