- Analytics
- News and Tools
- Market News
- Gold Price Forecast: XAU/USD holds gains above $1,900, downside looks supportive amid solid yields
Gold Price Forecast: XAU/USD holds gains above $1,900, downside looks supportive amid solid yields
- Gold price is oscillating above $1,900.00, however, the downside seems favored amid soaring yields.
- Fed Barkin cited that backing off from interest rate hiking too soon is not favorable.
- Higher monthly US Retail Sales data might rebound inflation projections.
Gold price (XAU/USD) is displaying a sideways auction profile above the round-level support of $1,900.00 in the Asian session. The precious metal is managing to sustain above $1,900.00, however, the downside seems supportive amid rising US Treasury yields after the hawkish commentary from Richmond Federal Reserve (Fed) Bank, President, Tom Barkin.
Fed policymaker cited that the economy has passed the phase of inflation peak but we are still far from the median Consumer Price Index (CPI). Therefore, backing off from interest rate hiking too soon is not favorable.
Meanwhile, volatility in the market is escalating as risk-perceived assets are losing traction. S&P500 futures have accelerated their losses, indicating strength in the risk-aversion theme. A decline in the risk appetite of the market participants has also weakened the demand for US government bonds. This has led to an increment in the 10-year US Treasury yields above 3.54%.
Going forward, investors will focus on the United States Producer Price Index (PPI) (Dec) and monthly Retail Sales (Dec) data. As per the estimates, the headline PPI (Dec) is seen lower at 6.8% while the core PPI is seen declining to 5.9%. Apart from that, monthly Retail Sales data might show an expansion of 0.1% vs. the contraction of 0.6% released earlier. Improvement in Retail Sales data might bolster the odds of a rebound in inflation projections.
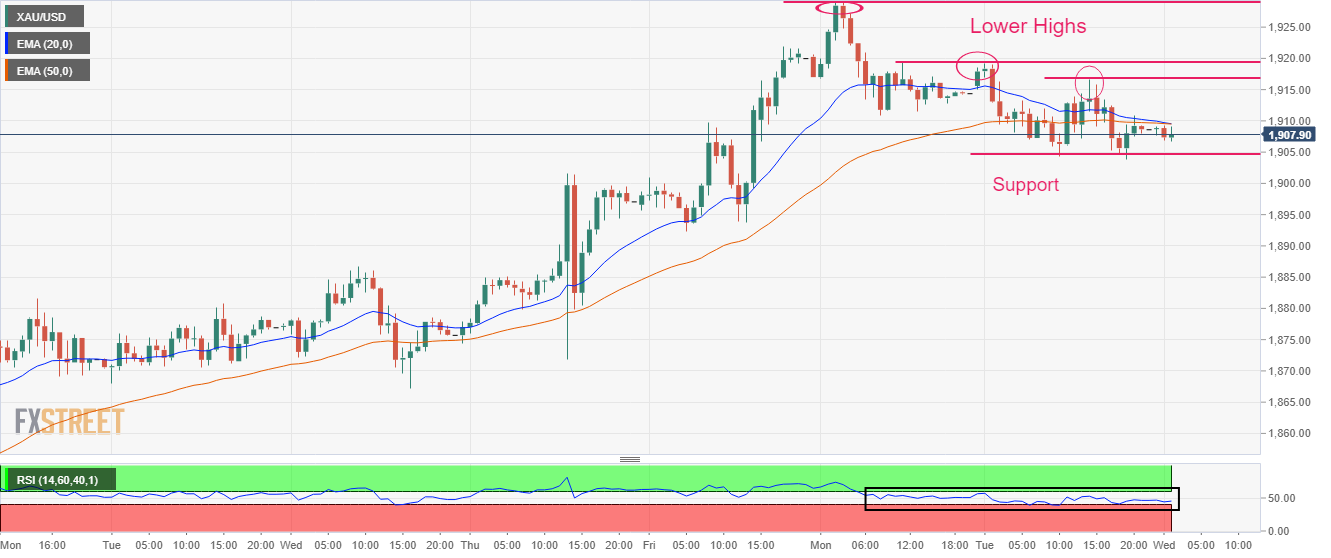
Gold technical analysis
Gold price is demonstrating the formation of Lower Highs on an hourly scale, communicating signs of bearish reversal. The precious metal might display sheer weakness after breaking the horizontal support plotted from Tuesday’s low marginally below $1,905.00.
The 20-and 50-period Exponential Moving Averages (EMAs) are on the verge of delivering a bearish cross over around $1,909.00.
The Relative Strength Index (RSI) (14) is oscillating in a 40.00-60.00 range. A slippage into the bearish range of 20.00-40.00 will activate a bearish momentum.
Gold hourly chart


© 2000-2026. All rights reserved.
This site is managed by Teletrade D.J. LLC 2351 LLC 2022 (Euro House, Richmond Hill Road, Kingstown, VC0100, St. Vincent and the Grenadines).
The information on this website is for informational purposes only and does not constitute any investment advice.
The company does not serve or provide services to customers who are residents of the US, Canada, Iran, The Democratic People's Republic of Korea, Yemen and FATF blacklisted countries.
Making transactions on financial markets with marginal financial instruments opens up wide possibilities and allows investors who are willing to take risks to earn high profits, carrying a potentially high risk of losses at the same time. Therefore you should responsibly approach the issue of choosing the appropriate investment strategy, taking the available resources into account, before starting trading.
Use of the information: full or partial use of materials from this website must always be referenced to TeleTrade as the source of information. Use of the materials on the Internet must be accompanied by a hyperlink to teletrade.org. Automatic import of materials and information from this website is prohibited.
Please contact our PR department if you have any questions or need assistance at pr@teletrade.global.
transfers