- Analytics
- News and Tools
- Market News
- USD/CAD Prior Analysis: Bears taking on bullish commitments near 1.3450 key area
USD/CAD Prior Analysis: Bears taking on bullish commitments near 1.3450 key area
- USD/CAD bears are taking on a double bottom near 1.3450 support area.
- Bears eye a 61.8% Fibonacci retracement near 1.3415 should the double bottom (DB) be breached.
USD/CAD is eating into the bullish rally's tracks from yesterday's business with 1.3450/30 eyed as a potential support structure in what has been a choppy descent from above 1.3500 on the day so far. The following illustrates the downside bias prior to the next wave of demand to the upside should the US dollar bulls be motivated by a discount in price in the coming sessions and days ahead.
USD/CAD prior analysis
It was stated at the start of the week, in the following analysis, USD/CAD Price Analysis: Bulls eye a break of 1.3450 for a look in at the 1.35 area, that the price was embarking on a correction but 1.3450 had to give out first:
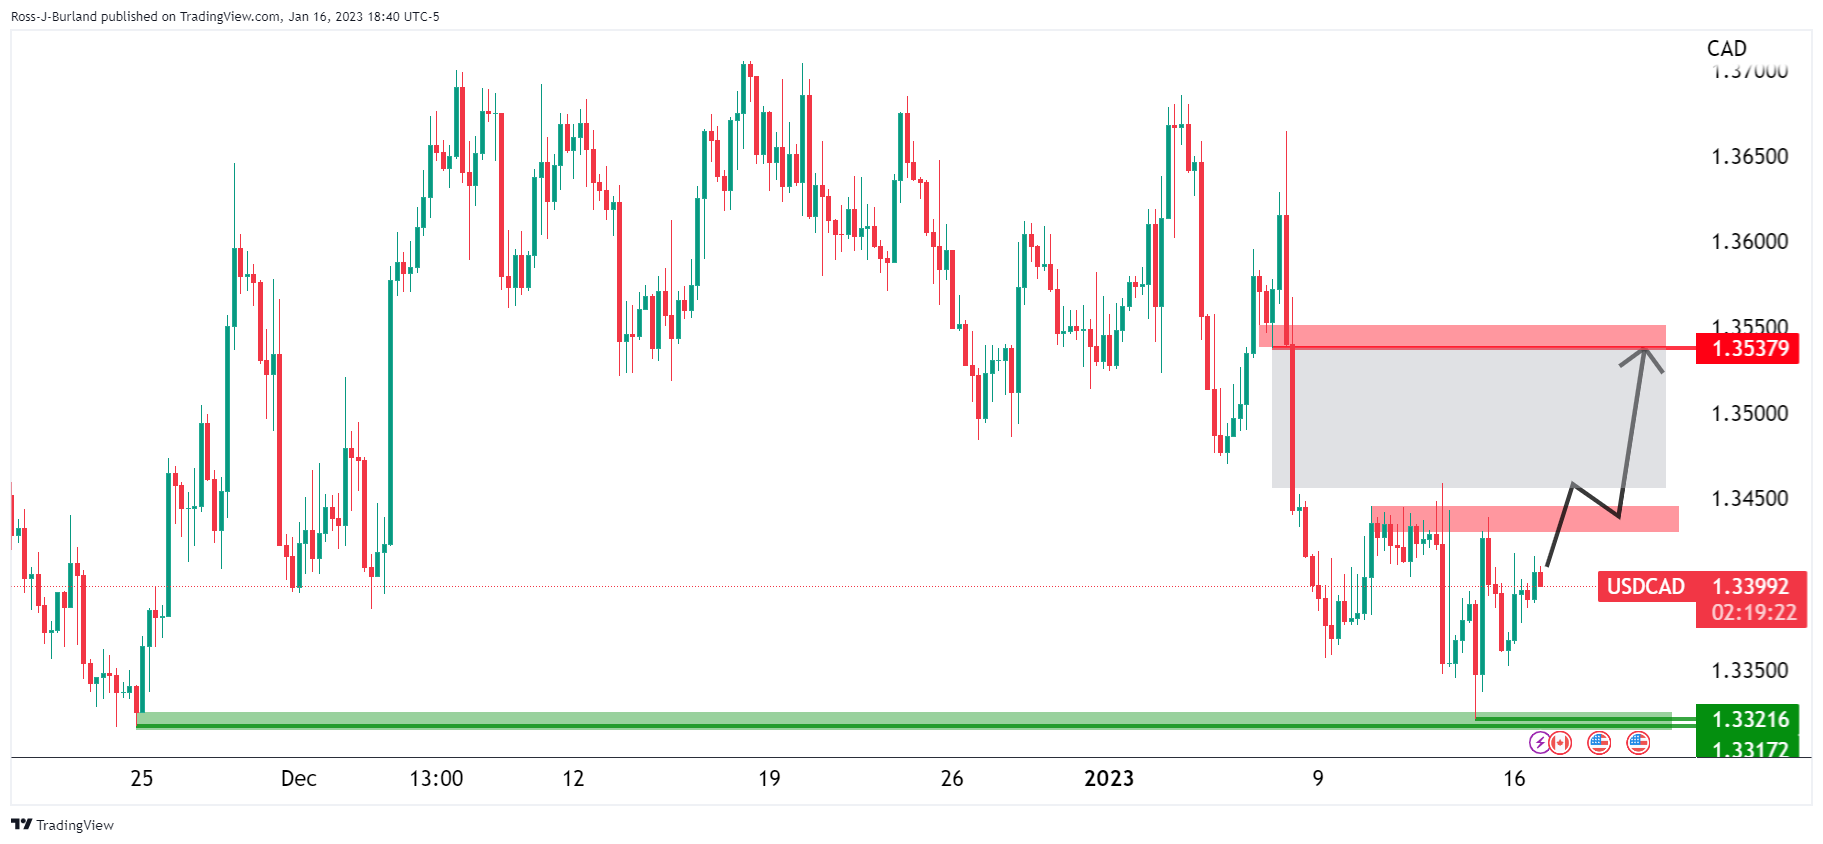
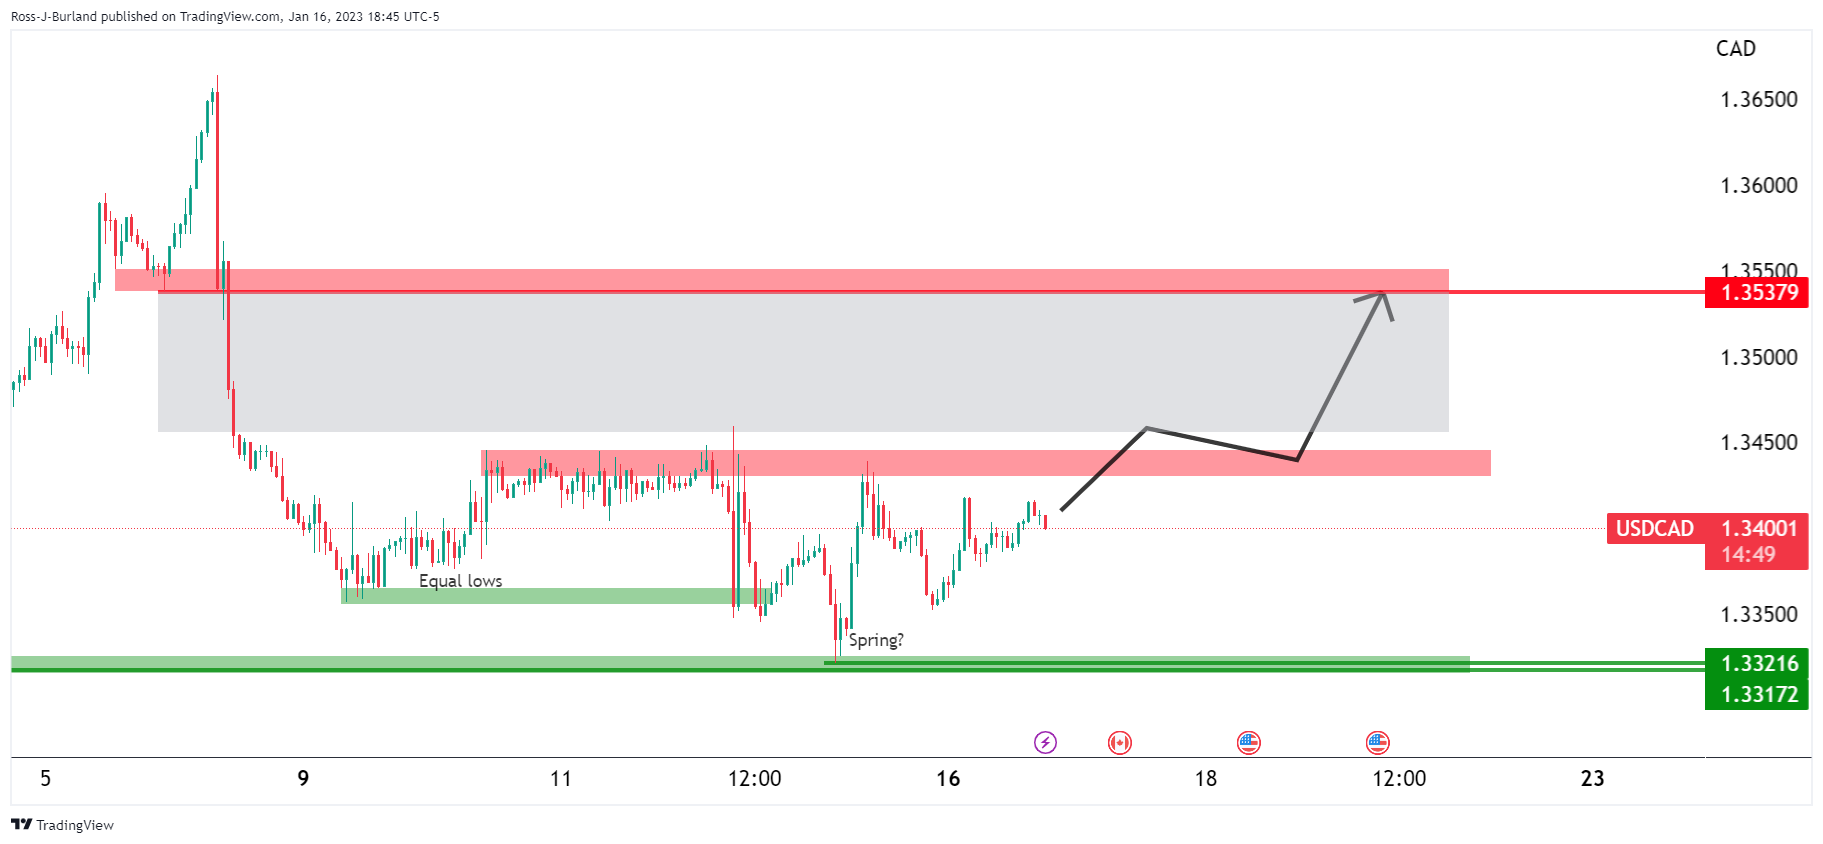
There was a price imbalance that had been left behind since the major sell-off at the start of the year. There was a thesis of mitigation towards 1.3550.
USD/CAD update
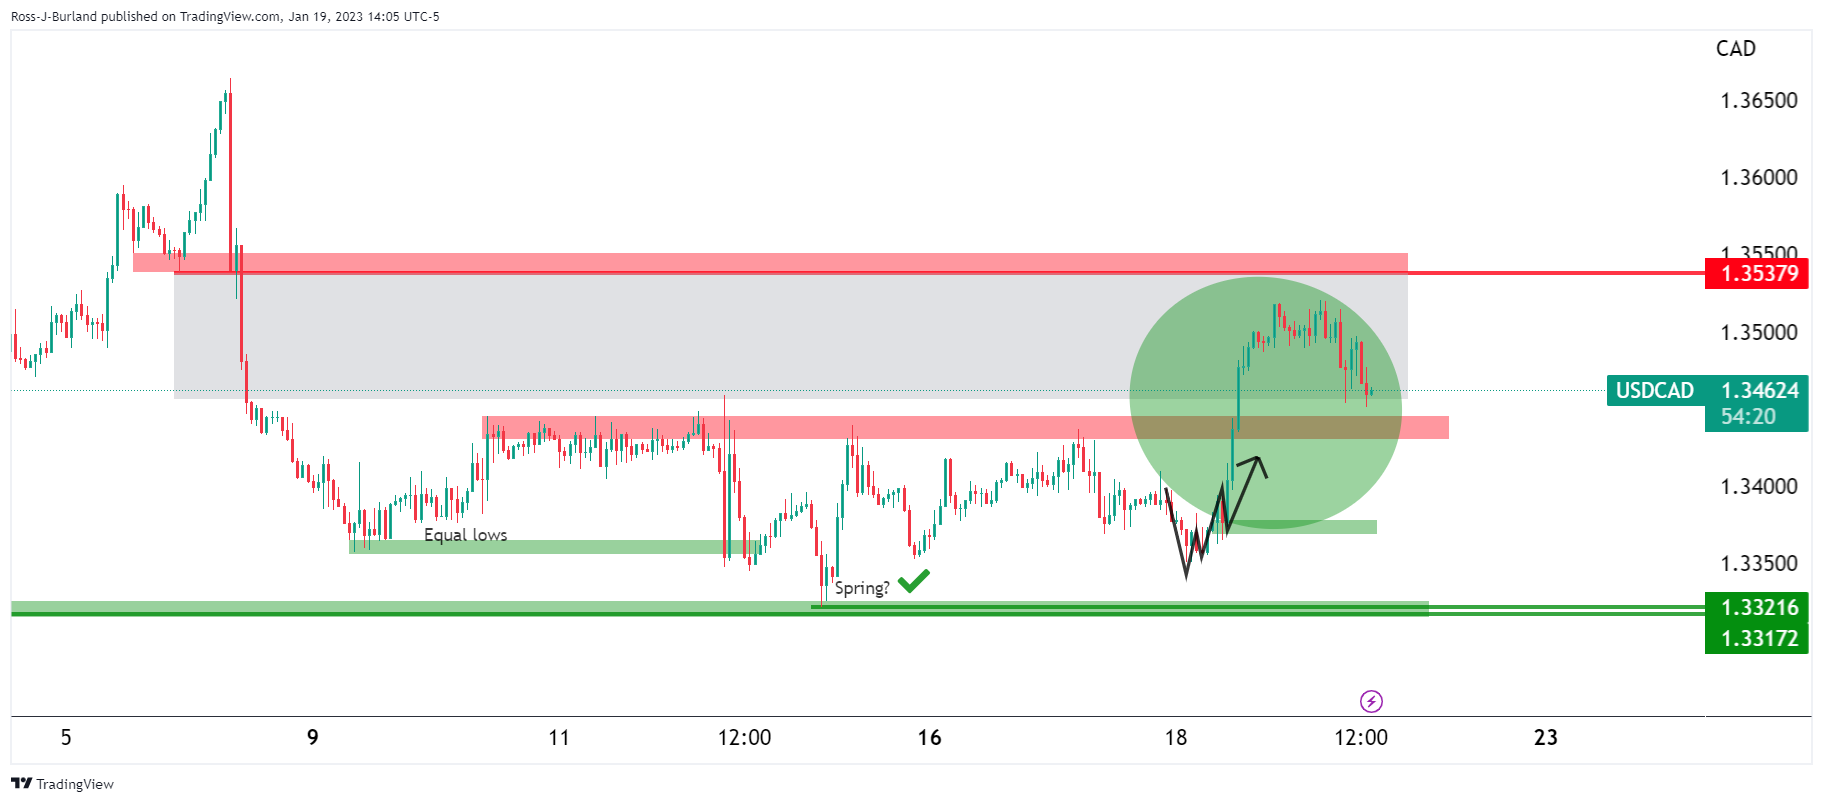
As illustrated, the bullish accumulation schematic played out, with the price respecting the spring and a subsequent break of resistance near 1.3450 leading to a drive to mitigate the price imbalance, albeit not in its entirety.
At this juncture, it is a matter of wait-and-see, but the bias is bullish while above the old resistance:
USD/CAD H4 chart
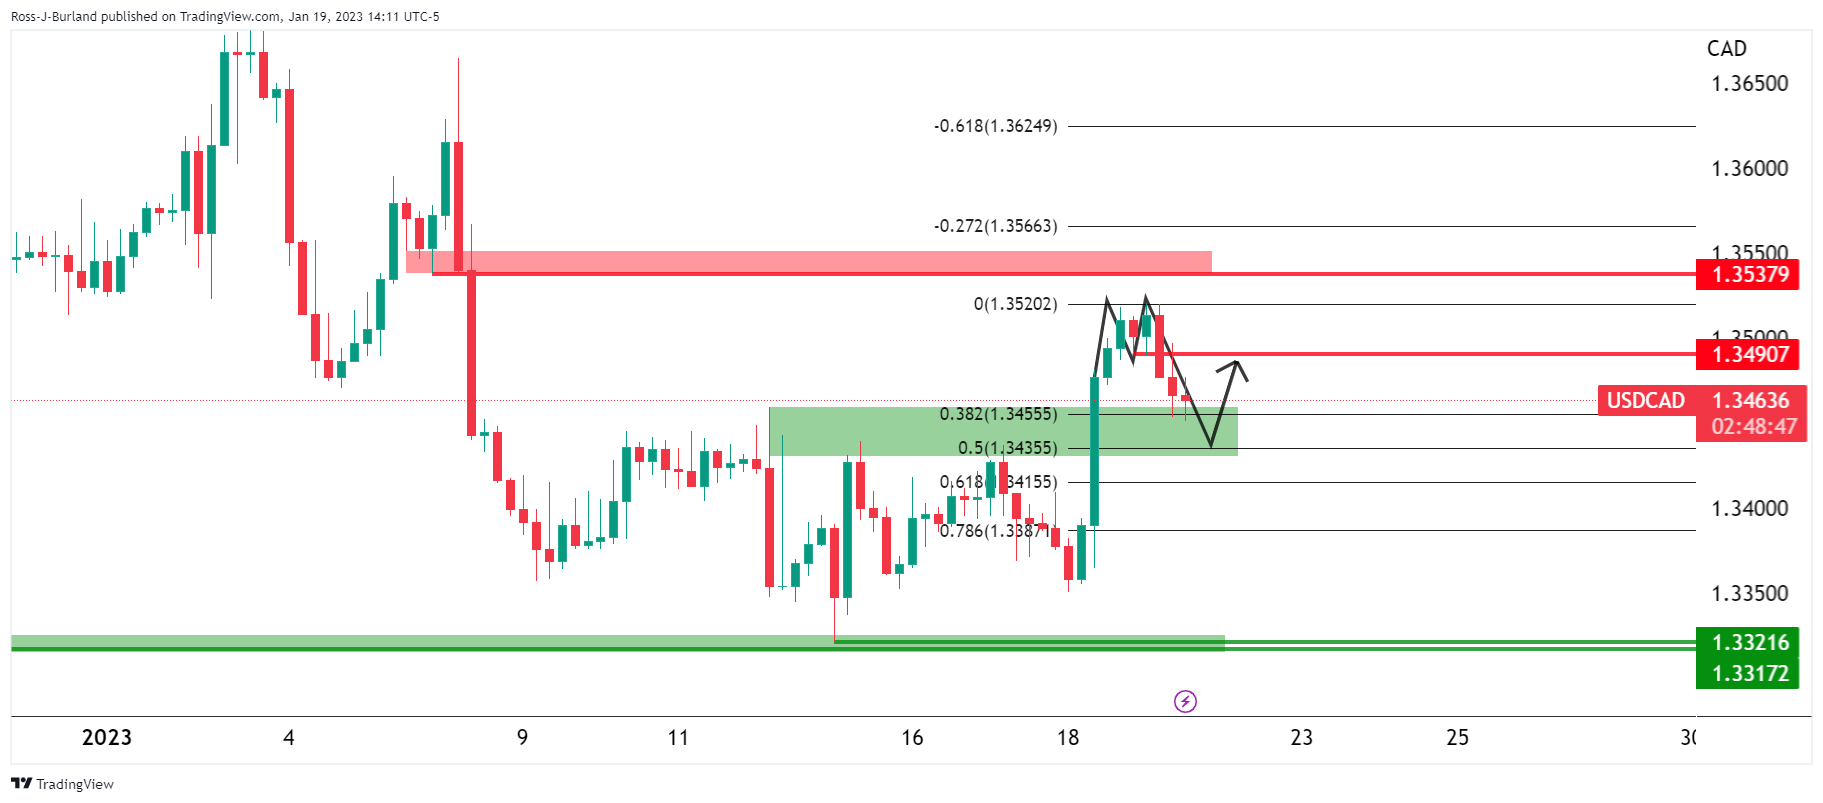
The price is forming an M-formation on the 4-hour chart. The pattern is a reversion set-up for the sessions ahead where the price would be expected to move back into the bearish impulse and target the neckline near 1.3490. However, the downside may not have been concluded as of yet, although there is a current deceleration near 1.3450 and a 38.2% Fibonacci retracement area of the prior bullish leg's range. Lower time frames can be assessed to gauge whether the bears are throwing in the towel which might prompt a move by the bulls in the day ahead:
USD/CAD 15-min chart
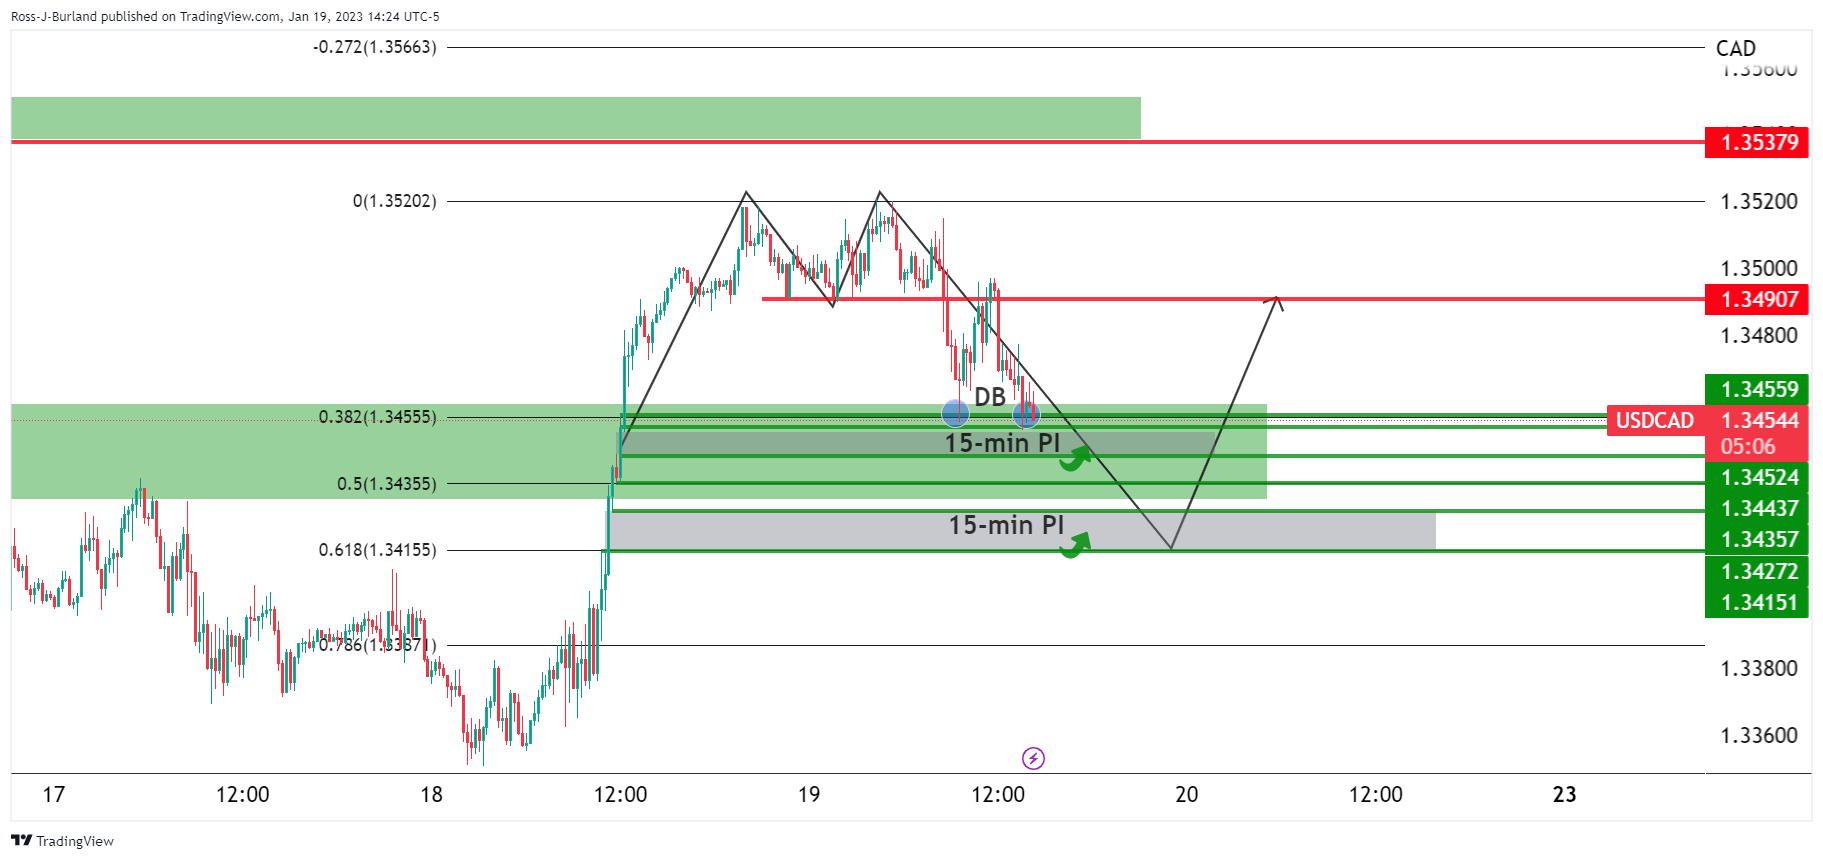
As per the 15-min chart, there are two price imbalances (PIs) that could be mitigated on the way to a 61.8% Fibonacci retracement near 1.3415 should the double bottom (DB) be breached.


© 2000-2026. All rights reserved.
This site is managed by Teletrade D.J. LLC 2351 LLC 2022 (Euro House, Richmond Hill Road, Kingstown, VC0100, St. Vincent and the Grenadines).
The information on this website is for informational purposes only and does not constitute any investment advice.
The company does not serve or provide services to customers who are residents of the US, Canada, Iran, The Democratic People's Republic of Korea, Yemen and FATF blacklisted countries.
Making transactions on financial markets with marginal financial instruments opens up wide possibilities and allows investors who are willing to take risks to earn high profits, carrying a potentially high risk of losses at the same time. Therefore you should responsibly approach the issue of choosing the appropriate investment strategy, taking the available resources into account, before starting trading.
Use of the information: full or partial use of materials from this website must always be referenced to TeleTrade as the source of information. Use of the materials on the Internet must be accompanied by a hyperlink to teletrade.org. Automatic import of materials and information from this website is prohibited.
Please contact our PR department if you have any questions or need assistance at pr@teletrade.global.
transfers