- Analytics
- News and Tools
- Market News
- Gold Price Forecast: XAU/USD looks to surpass $1,940 amid weaker yields, US GDP eyed
Gold Price Forecast: XAU/USD looks to surpass $1,940 amid weaker yields, US GDP eyed
- Gold price is attempting to surpass $1,940.00 as US yields drop further.
- The USD Index to remain weak this year as attention is turning towards policy tightening in other advanced economies.
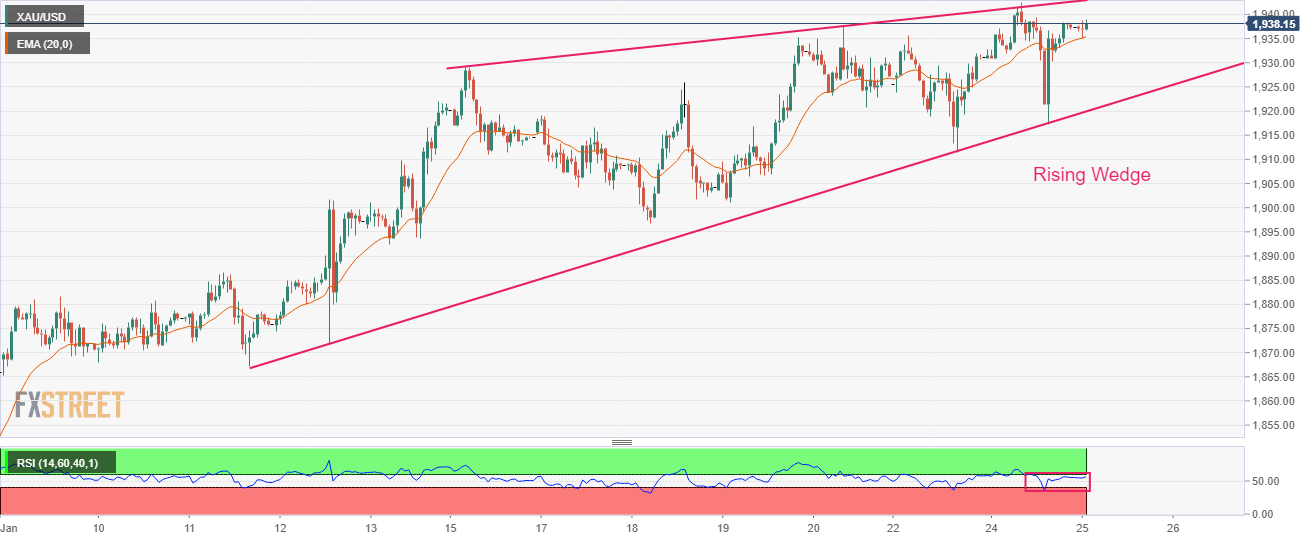
- Gold price is auctioning in a Rising Wedge, portraying a volatility contraction.
Gold price (XAU/USD) is aiming to overstep the immediate resistance of $1,940.00 in the Tokyo session. The precious metal is gaining strength amid rising demand for the US government bonds that have weakened yields further. The 10-year US Treasury yields have dropped to near 3.45%.
A sell-off in the S&P500 futures is indicating that the risk-taking capacity of the market participants is fading away. Missed estimates by tech-giant Microsoft in its December earnings and technical glitch in NYSE are impacting United States equities. The US Dollar Index (DXY) is displaying a sideways profile around 101.50 as investors await US Gross Domestic Product (GDP) data for fresh impetus.
Gold price might find strength if US GDP contracts dramatically, which might further bolster the expectations for a smaller interest rate hike by the Federal Reserve (Fed) in its February meeting. As per the estimates, the annual Q4CY2022 GDP will contract to 2.8% from the former release of 3.2%. For the USD Index outlook, economists at CIBC Capital Markets look for the mighty US Dollar to weaken in 2023 as the Fed is set to undershoot market expectations for the peak fed funds rate, and attention turning to policy tightening in other advanced economies.
Gold technical analysis
Gold price is auctioning in a Rising Wedge chart pattern on an hourly scale that indicates volatility contraction, which will result in wider ticks and heavy volume after an explosion. The 20-period Exponential Moving Average (EMA) at $1,935.33 is acting as a cushion for the Gold bulls.
Meanwhile, the Relative Strength Index (RSI) (14) is oscillating in a 40.00-60.00 range that demonstrates a lackluster performance by the Gold price ahead.
Gold hourly chart


© 2000-2026. All rights reserved.
This site is managed by Teletrade D.J. LLC 2351 LLC 2022 (Euro House, Richmond Hill Road, Kingstown, VC0100, St. Vincent and the Grenadines).
The information on this website is for informational purposes only and does not constitute any investment advice.
The company does not serve or provide services to customers who are residents of the US, Canada, Iran, The Democratic People's Republic of Korea, Yemen and FATF blacklisted countries.
Making transactions on financial markets with marginal financial instruments opens up wide possibilities and allows investors who are willing to take risks to earn high profits, carrying a potentially high risk of losses at the same time. Therefore you should responsibly approach the issue of choosing the appropriate investment strategy, taking the available resources into account, before starting trading.
Use of the information: full or partial use of materials from this website must always be referenced to TeleTrade as the source of information. Use of the materials on the Internet must be accompanied by a hyperlink to teletrade.org. Automatic import of materials and information from this website is prohibited.
Please contact our PR department if you have any questions or need assistance at pr@teletrade.global.
transfers