- Analytics
- News and Tools
- Market News
- GBP/USD Price Analysis: Slides below 1.2000 amid modest USD strength, ahead of Fed’s Powell
GBP/USD Price Analysis: Slides below 1.2000 amid modest USD strength, ahead of Fed’s Powell
- GBP/USD retreats sharply from a four-day top amid the emergence of fresh USD buying.
- A break below the 200-day SMA is needed to support prospects for any further downside.
- Traders now look to Fed Chair Jerome Powell’s testimony for some meaningful impetus.
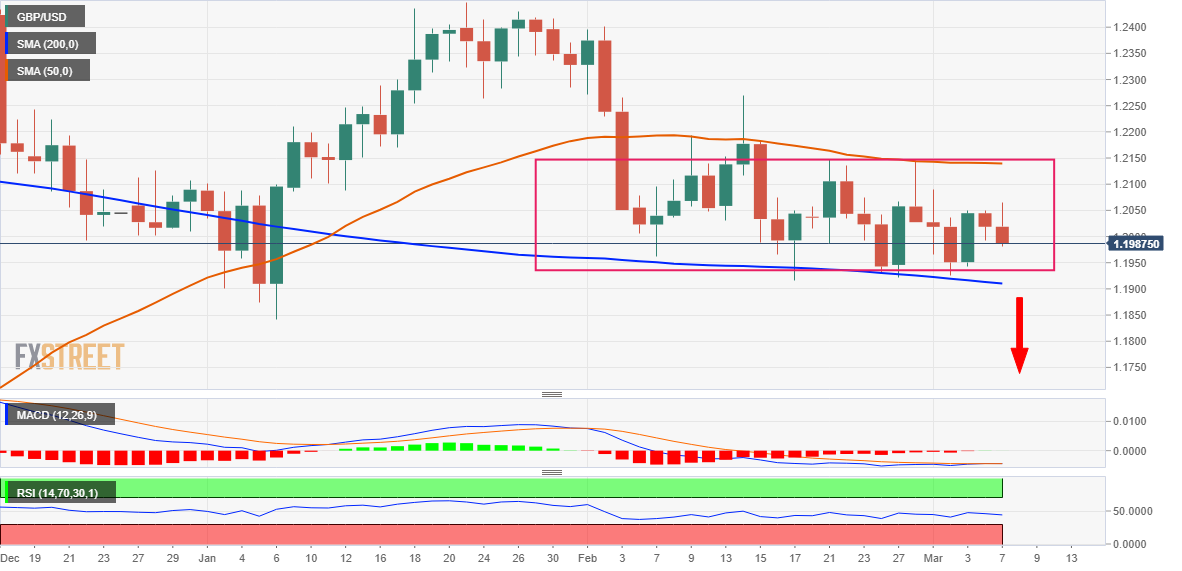
The GBP/USD pair comes under some renewed selling pressure following an early uptick to the 1.2065 area, or a multi-day top touched earlier this Tuesday and extends the downfall through the mid-European session. The pair slides back below the 1.2000 psychological mark in the last hour and is pressured by the emergence of fresh US Dollar buying.
Growing acceptance that the Federal Reserve will stick to its hawkish stance and keep interest rates higher for longer turn out to be a key factor that continues to act as a tailwind for the USD. Apart from this, looming recession risks further seem to benefit the Greenback's relative safe-haven status amid some repositioning trade ahead of Fed Chair Jerome Powell's semi-annual testimony before the Senate Banking Committee.
Looking at the broader picture, the two-way price moves witnessed over the past four weeks or so constitute the formation of a rectangle on the daily chart. The lower end of the trading band coincides with a technically significant 200-day Simple Moving Average (SMA). Bearish traders need to wait for a convincing break through the said support, currently pegged around the 1.1910 area, before placing fresh bets.
The GBP/USD pair might then turn vulnerable to accelerate the fall towards retesting the YTD low, around the 1.1840 region touched in January. Some follow-through selling will complete a bearish double-top pattern formation near the 1.2445-1.2450 area and pave the way for deeper losses. The downward trajectory could eventually drag spot prices below the 1.1800 mark, towards the 1.1725 support zone.
On the flip side, the daily swing high, around the 1.2065 area, now seems to act as an immediate barrier ahead of the 1.2100 mark. Any subsequent move-up could attract fresh sellers and remain capped near the 50-day SMA, around the 1.2135-1.2140 region. That said, a sustained strength beyond could lift the GBP/USD pair towards the 1.2200 mark en route to the February 14 peak, around the 1.2265-1.2270 zone.
GBP/USD daily chart
Key levels to watch


© 2000-2026. All rights reserved.
This site is managed by Teletrade D.J. LLC 2351 LLC 2022 (Euro House, Richmond Hill Road, Kingstown, VC0100, St. Vincent and the Grenadines).
The information on this website is for informational purposes only and does not constitute any investment advice.
The company does not serve or provide services to customers who are residents of the US, Canada, Iran, The Democratic People's Republic of Korea, Yemen and FATF blacklisted countries.
Making transactions on financial markets with marginal financial instruments opens up wide possibilities and allows investors who are willing to take risks to earn high profits, carrying a potentially high risk of losses at the same time. Therefore you should responsibly approach the issue of choosing the appropriate investment strategy, taking the available resources into account, before starting trading.
Use of the information: full or partial use of materials from this website must always be referenced to TeleTrade as the source of information. Use of the materials on the Internet must be accompanied by a hyperlink to teletrade.org. Automatic import of materials and information from this website is prohibited.
Please contact our PR department if you have any questions or need assistance at pr@teletrade.global.
transfers