- Analytics
- News and Tools
- Market News
- AUD/USD Price Analysis: Absence of recovery signals favors more downside, 0.6500 eyed
AUD/USD Price Analysis: Absence of recovery signals favors more downside, 0.6500 eyed
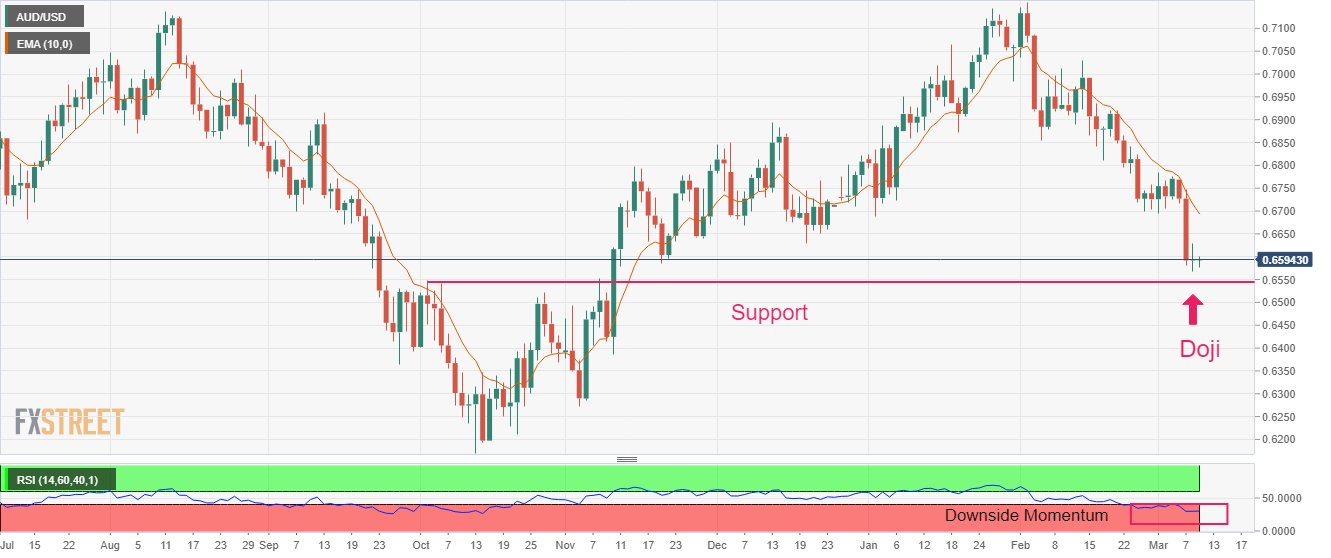
- AUD/USD is attempting to scale above 0.6600, however, the risk-off mood is still intact.
- A Doji candlestick formation indicates indecisiveness among market participants.
- An oscillation in the 20.00-40.00 range by the RSI (14) indicates that the bearish momentum is currently active.
The AUD/USD pair is displaying a subdued performance below 0.6600 in the Asian session. The upside in the Aussie asset seems restricted as Reserve Bank of Australia (RBA) Governor Philip Lowe has considered a pause in the rate-hiking spree and the Chinese economy is struggling to accelerate domestic demand despite significant reopening measures.
S&P500 futures have witnessed immense pressure as a sense of deflation conveyed by Chinese Consumer Price Index (CPI) and Producer Price Index (PPI) data indicates that the economy will take plenty of time to strengthen its economic outlook.
The US Dollar Index (DXY) is auctioning in a limited range above 105.20 as investors are awaiting the release of the United States Nonfarm Payrolls (NFP) data for fresh impetus.
AUD/USD has formed a Doji candlestick pattern, which indicates indecisiveness among the sentiment of market participants for further direction. Usually, a Doji formation indicates a reversal after an established trend. However, it requires more filters to confirm a reversal. Also, the negligence of Doji is considered as the continuation of the ongoing trend.
The Australian Dollar might continue to face selling pressure from the 10-period Exponential Moving Average (EMA) at around 0.6700.
An oscillation in the 20.00-40.00 range by the Relative Strength Index (RSI) (14) indicates that the bearish momentum is currently active. The momentum indicator is not shown any sign of divergence and a situation of oversold.
Going forward, a breakdown of Wednesday’s low at 0.6568 will drag the asst toward the horizontal support plotted from October 4 high at 0.6547 followed by the round-level support at 0.6500.
In an alternate scenario, a break above Doji’s high at 0.6629 will push the Aussie asset toward December 22 low at 0.6650. A break above the same might expose the major to February 27 low near 0.6700.
AUD/USD daily chart


© 2000-2026. All rights reserved.
This site is managed by Teletrade D.J. LLC 2351 LLC 2022 (Euro House, Richmond Hill Road, Kingstown, VC0100, St. Vincent and the Grenadines).
The information on this website is for informational purposes only and does not constitute any investment advice.
The company does not serve or provide services to customers who are residents of the US, Canada, Iran, The Democratic People's Republic of Korea, Yemen and FATF blacklisted countries.
Making transactions on financial markets with marginal financial instruments opens up wide possibilities and allows investors who are willing to take risks to earn high profits, carrying a potentially high risk of losses at the same time. Therefore you should responsibly approach the issue of choosing the appropriate investment strategy, taking the available resources into account, before starting trading.
Use of the information: full or partial use of materials from this website must always be referenced to TeleTrade as the source of information. Use of the materials on the Internet must be accompanied by a hyperlink to teletrade.org. Automatic import of materials and information from this website is prohibited.
Please contact our PR department if you have any questions or need assistance at pr@teletrade.global.
transfers